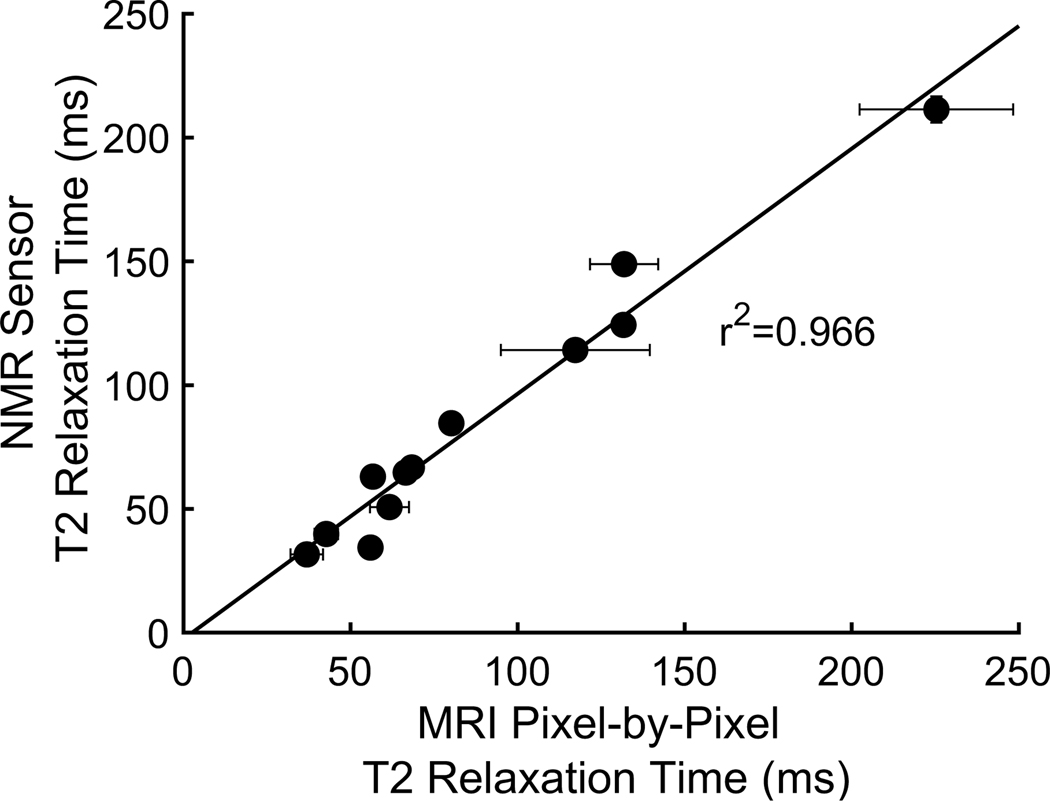
Figure 5. Comparison of T2 relaxation times from MRI pixel-by-pixel and NMR sensor.
Both mono- and bi-exponential fit results of each of the six phantoms and ex-vivo tissue samples. There is a strong correlation between the MRI and NMR sensor values (r2=0.966) suggesting that the results can be translated between the two sensors. Vertical (NMR sensor) error bars represent the 95% confidence interval for the fit. Horizontal (MRI) error bars represent the standard deviation of the pixel-by-pixel MRI results.

