
Fig. 6. Combination immunotherapy promotes recognition and long-term immunity against wild type tumor-lineage self-antigens.
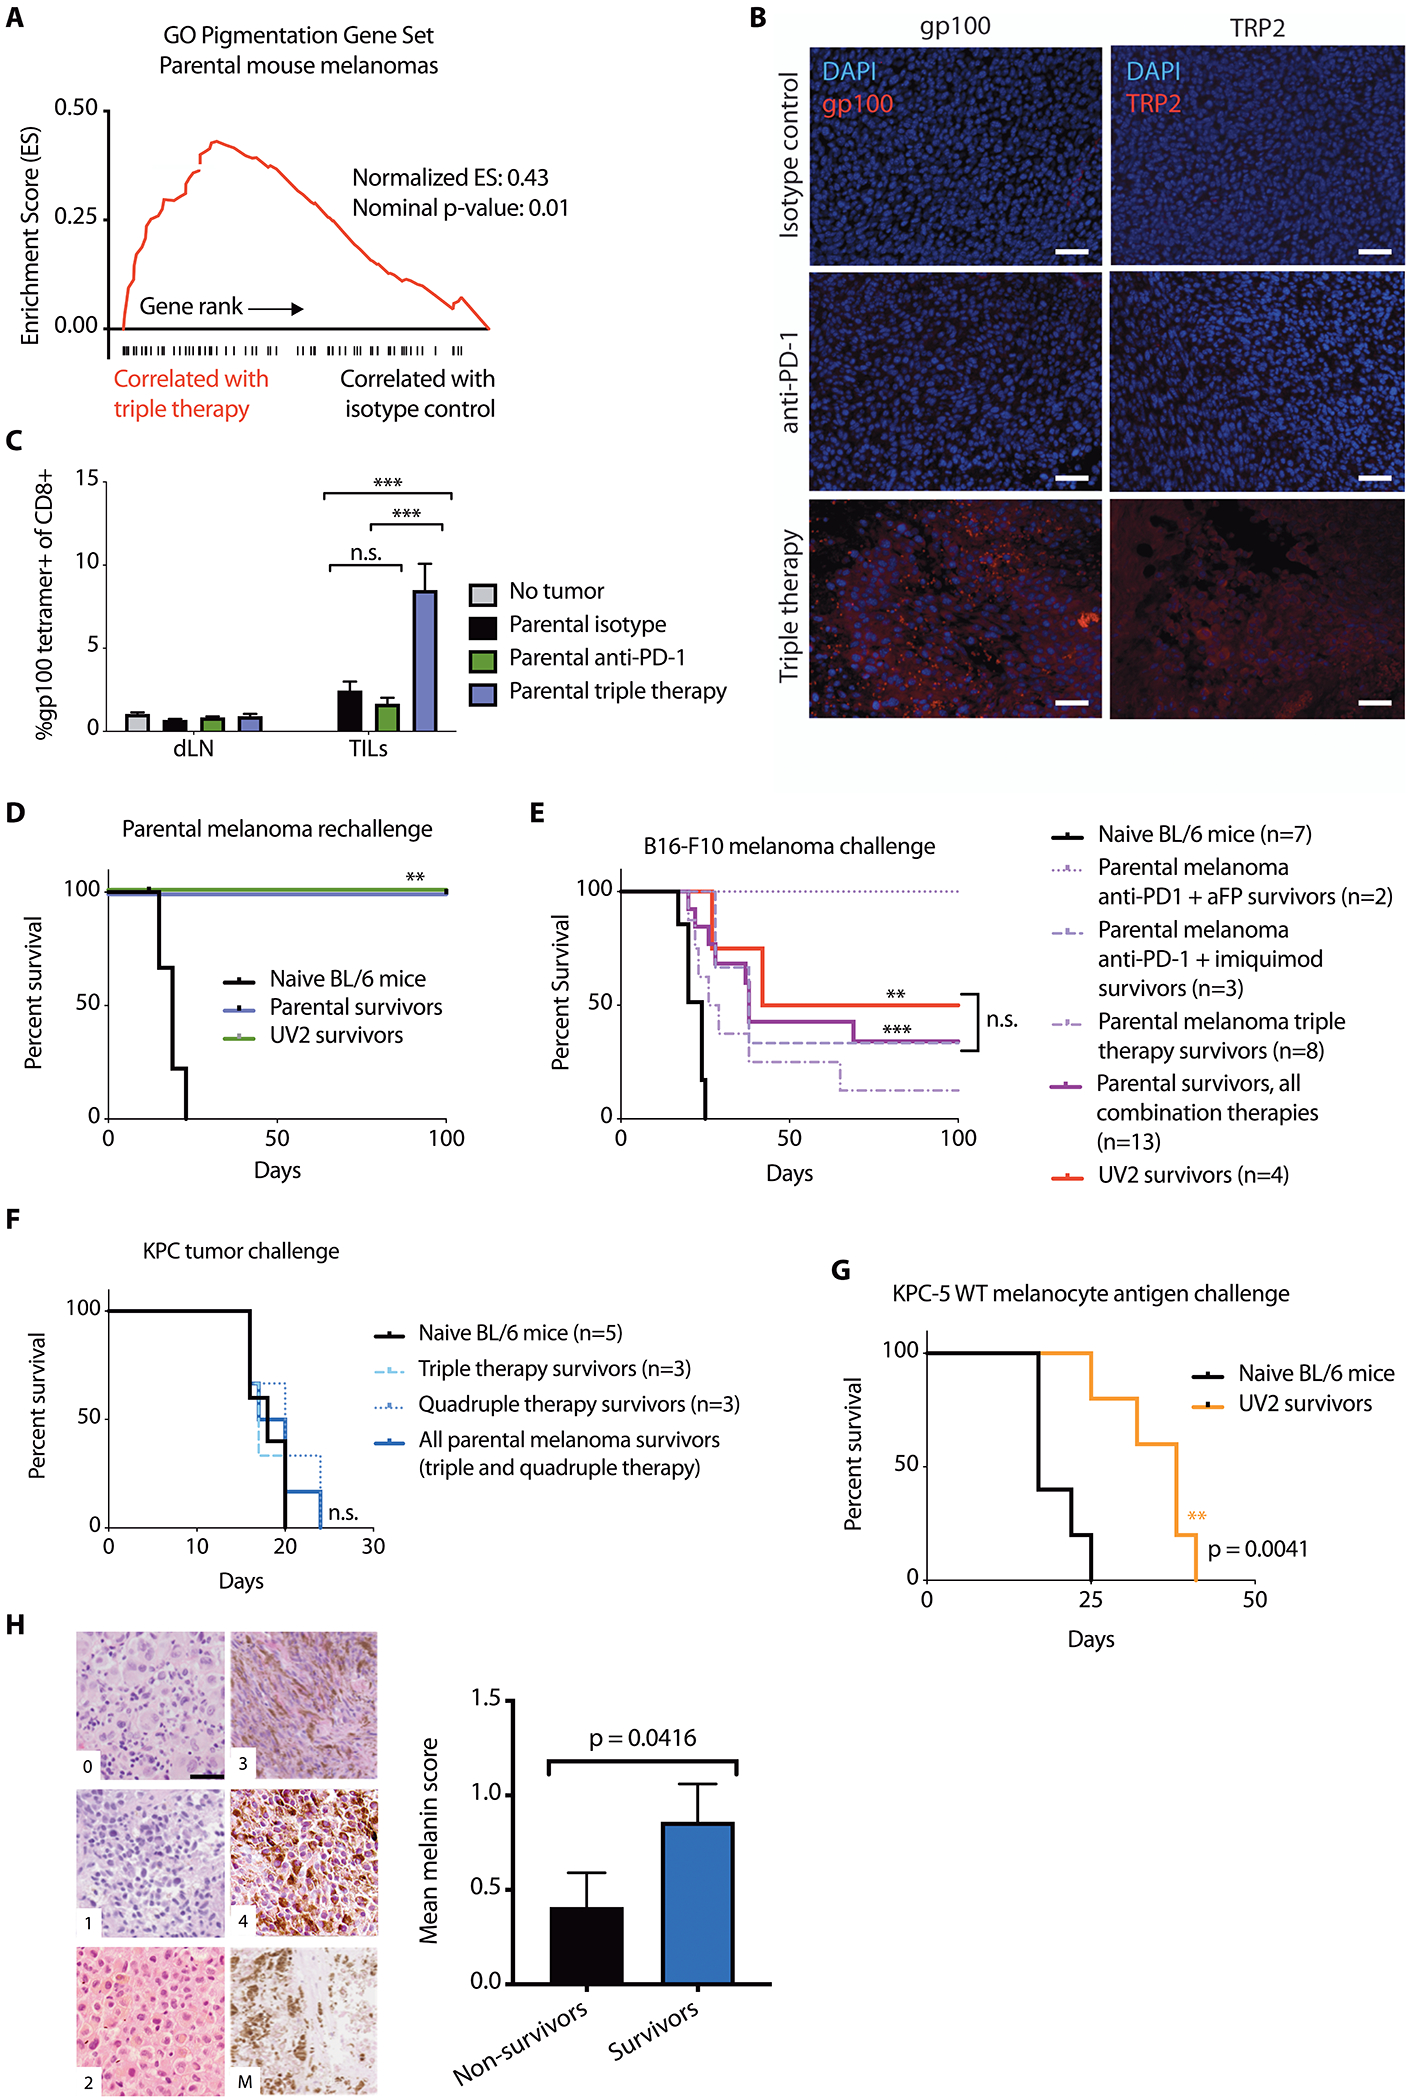
(A) GSEA plot showing enrichment of pigmentation gene set GO:0043473 in triple therapy (anti-PD-1+aFP+imiquimod)-treated mouse parental D4M.3A.3 melanomas. (B) Immunofluorescence imaging reveals expression of gp100 (left) and TRP2 (right) after anti-PD-1+aFP+imiquimod triple therapy in mouse parental melanomas 5 days after initiation of therapy. Scale bar: 50 μm. (C) CD8+ T cells from treated flank parental melanomas (TILs) and from draining lymph nodes (dLNs) 5 days after initiation of therapy were evaluated for binding to gp100:H-2Db tetramer (n=4 mice for no tumor control, n=8 for all other groups). Data are shown as means ± SEM. (D) Survival of parental (n=3) or UV2 (n=3) melanoma-bearing mice with complete responses to triple therapy or naïve mice (n=10), after challenge with 1 × 10⁵ parental melanoma cells. (E) Survival of UV2 melanoma-bearing mice with complete responses to anti-PD-1+anti-CTLA-4 (n=4), or parental melanoma-bearing mice with complete responses to triple therapy (n=8), anti-PD-1+aFP (n=2), anti-PD-1+imiquimod (n=3), or naïve mice (n=7), after challenge with 1 x 10⁵ B16-F10 melanoma cell inoculation. (F) Survival of parental melanoma-bearing mice with complete responses to triple therapy (n=3) or quadruple therapy (n=3), or naïve mice (n=5), after subcutaneous challenge with 1 × 10⁵ KPC cells. (G) Survival of UV2 melanoma-bearing mice with complete responses to anti-PD-1 (n=5), or naïve mice (n=5) after challenge with subcutaneous inoculation of 1.5 × 10⁵ KPC-5 wild type melanocyte antigen combo cells. (H) Tumor samples from patients with melanoma treated with anti-PD-1 were scored in a blinded manner based on melanin content in hematoxylin and eosin sections. Representative images (left) depict cytoplasmic melanin scoring using published parameters (37). Scale bar: 20 μm. Patient melanin scores were stratified by survival status at 2 years after starting anti-PD-1 (right). For patients with multiple tumor blocks available (from multiple masses or time points), the mean score was calculated per patient. Data are shown as mean average melanin score ± SEM, n=22 non-survivors and 27 survivors at 2-year follow up. **p<0.01; ***p<0.001; n.s., no significant difference for statistical analyses conducted by one-way ANOVA with Tukey’s post hoc test (C), log-rank test (D to G), or Mann-Whitney test (H).