
Extended Data Fig. 2 |. Ac4C in eukaryotic cells with wild-type NAT10 expression.
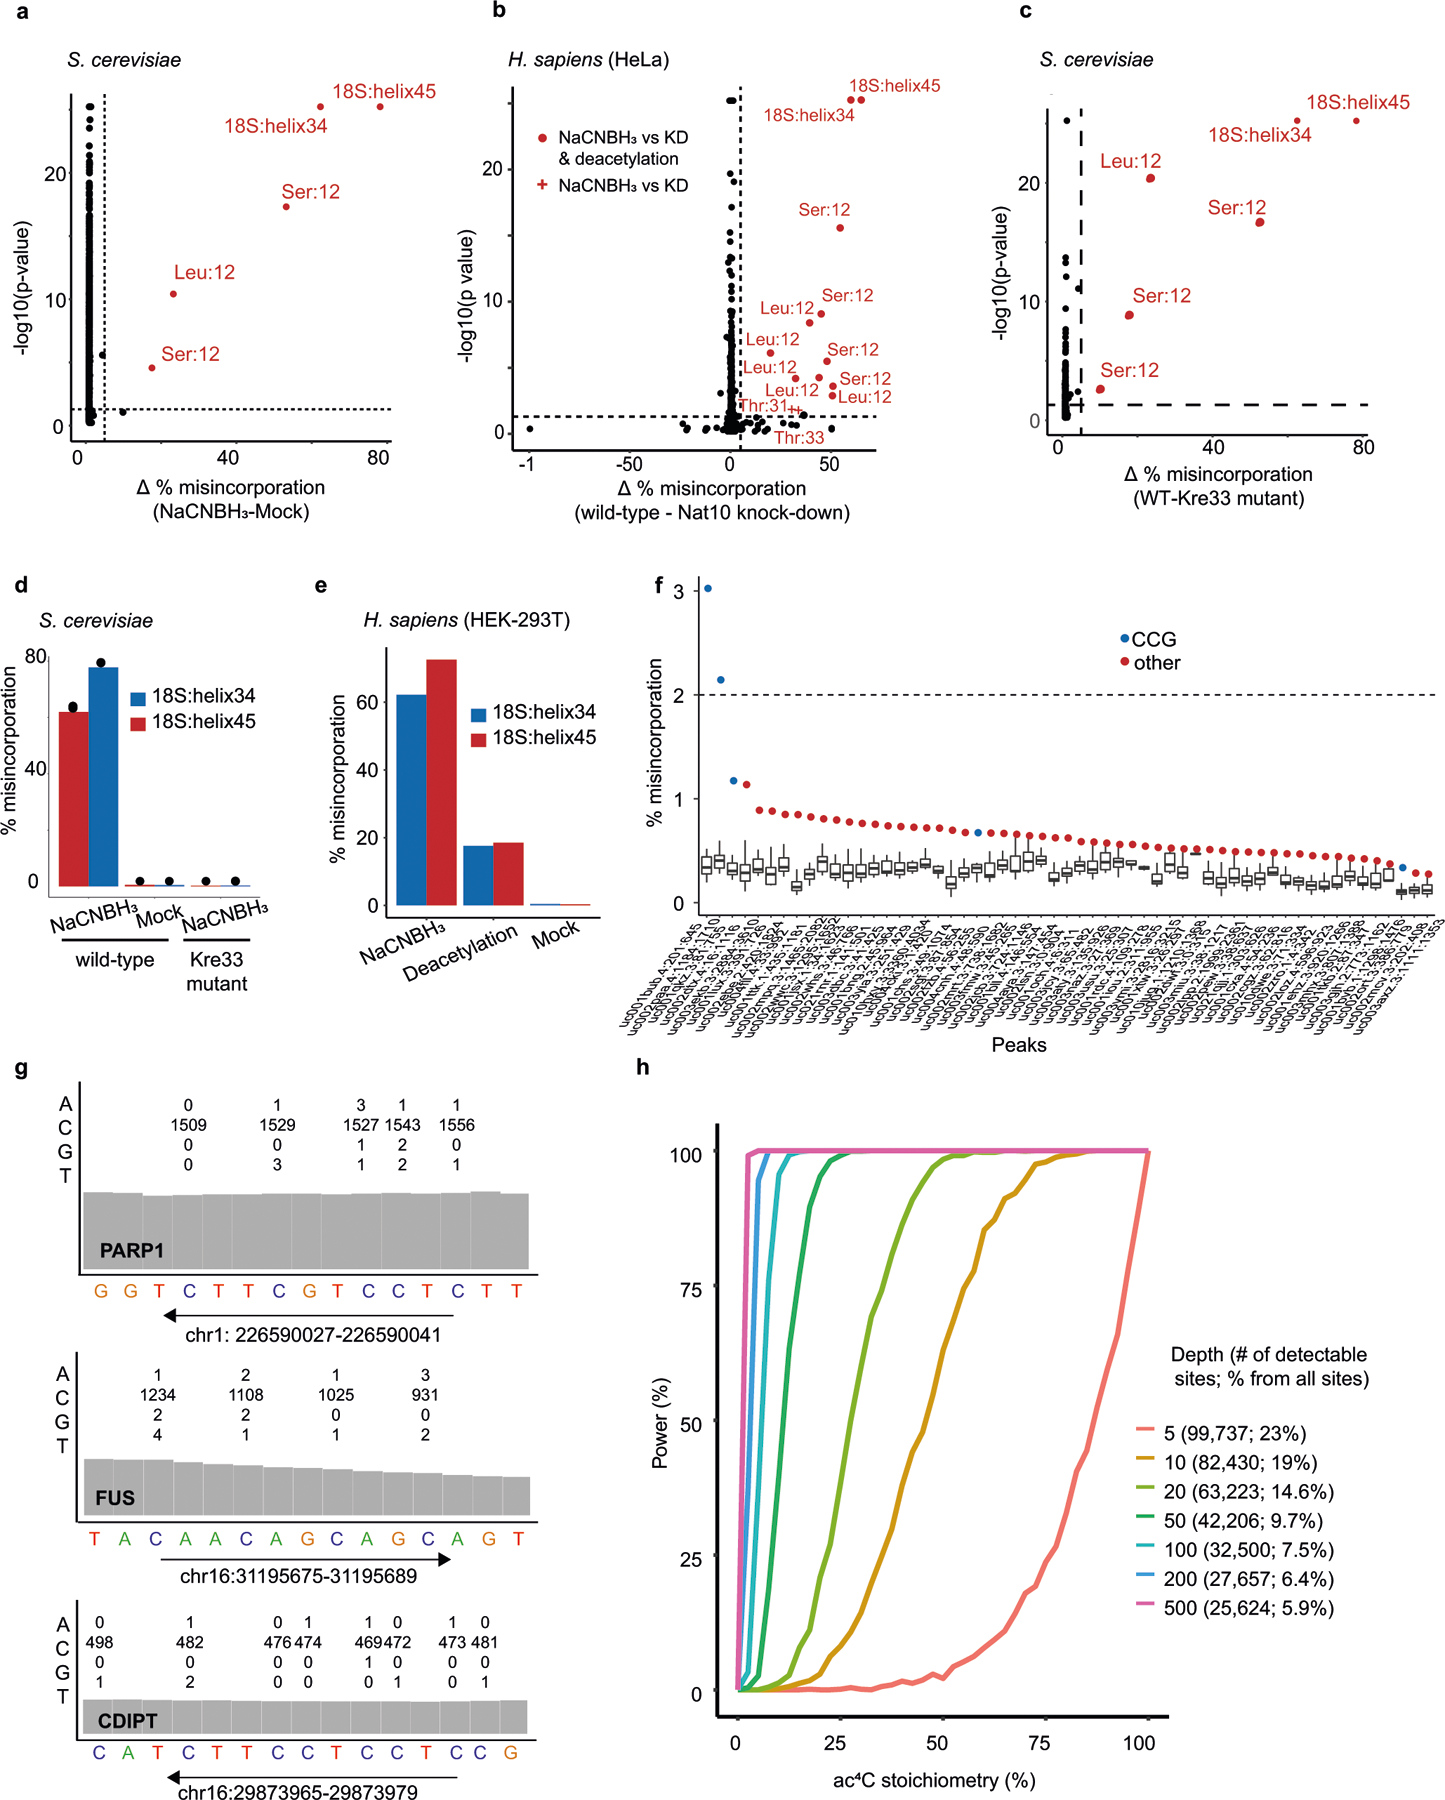
a–c, ac4C-seq was conducted on RNA from S. cerevisiae (a, c) and HeLa cells (b). Statistical significance from the χ2 test is plotted against the difference in misincorporation rates (corresponding to ac4C levels) between NaCNBH3-treated and mock-treated RNA from S. cerevisiae (a), RNA from wild-type and NAT10-depleted cells (b) or from wild-type S. cerevisiae cells and a strain expressing a catalytic mutant of Kre33 (c), treated with NaCNBH3. Sites with a differential misincorporation level >5% and a P value <0.05 are labelled and marked in red. For HeLa cells (b) an additional comparison between NaCNBH3 and deacetylation pre-treatment was conducted. Sites that do not pass significance under these conditions are marked with a plus sign (shown only for sites found significant between NaCNBH3 and mock treatment). Significant sites are labelled with the identity of the molecule and the relative position (or helix) of ac4C. n = 3 biologically independent samples for all but NAT10-depleted HeLa cells, in which case n = 2 biologically independent samples. d, e, Misincorporation level in the two known sites in 18S (helix 34 and helix 45), compared with controls in poly(A)-enriched RNA from wild-type S. cerevisiae cells and S. cerevisiae cells expressing a catalytic mutant of Kre33 (d) and from wild-type HEK-293T cells and HEK-293T cells overexpressing NAT10 and THUMPD1 (e). f, g, ac4C-seq data from poly(A)-enriched RNA from HEK-293T cells overexpressing NAT10 and THUMPD1 on ‘ac4C peaks’ that have been identified previously10 as harbouring ac4C. f, Distribution of misincorporation across each of 57 ‘ac4C peaks’ that had a coverage of more than 400 reads in more than 80% of the cytosines in the peak. For each peak the cytosine harbouring the highest misincorporation rate is indicated in colour, presented in blue if it harbours a CCG motif and red otherwise. g, Traces from the Integrative Genomic Viewer (IGV) browser of three such genes, with highest coverage in the ac4C-seq data. For each gene the 15 bases motif identified in ref. 10 is presented. The numbers above each cytidine indicate the number of bases (A, C, G and T) observed in our data at that position. h, Power analysis for ac4C detection, as a function of sequencing depths and stoichiometries. Each data point in each curve is based on 1,000 simulations. For each sampled depth, numbers in the legend indicate the sequencing depth, which was kept identical for treatment and control samples. In addition, the legend indicates the number of CCG sites found in wild-type HEK-293T samples that have such a minimal depth and the percentage of these detectable CCG sites from all CCG sites in the transcriptome.