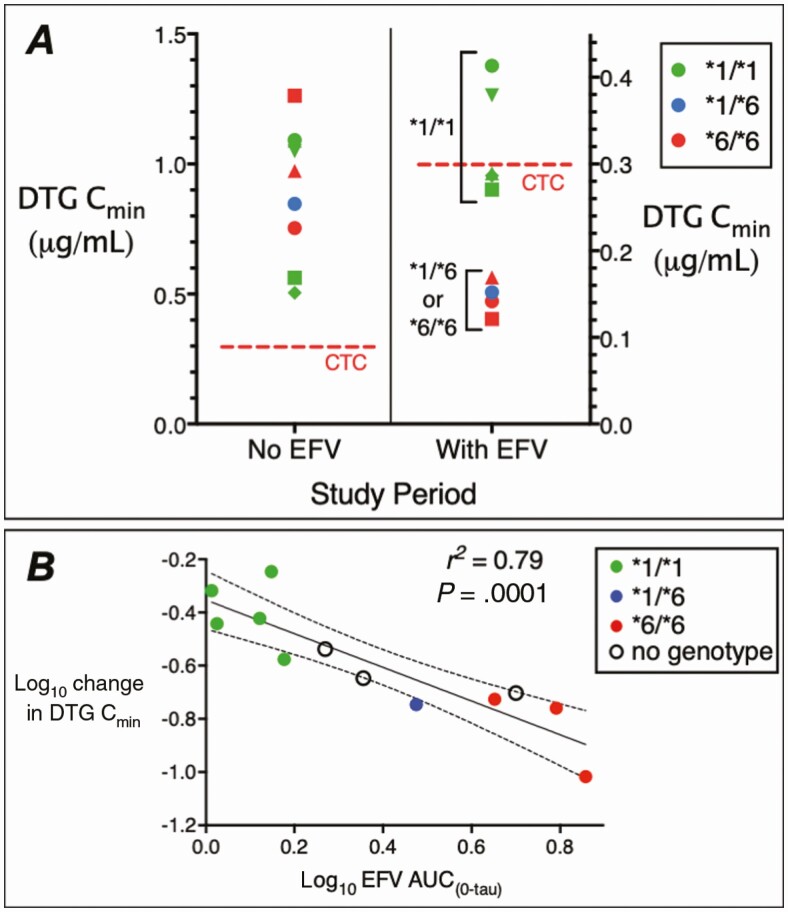
Figure 1.
Pharmacogenetics of the interaction of dolutegravir (DTG) with efavirenz (EFV). A, Plasma DTG minimum concentration (Cmin) values among 9 volunteers after 5 days of DTG 50 mg every 24 hours without EFV (left), and after 14 days of DTG 50 mg every 24 hours plus EFV 600 mg every 24 hours (right). The red dashed lines indicate the DTG clinical target concentration (CTC) of 0.3 μg/mL. Different marker shapes distinguish participants. Note the different y-axis scales. B, Relationship between log10 change in plasma DTG Cmin values and log10 plasma EFV area under the concentration-time curve (AUC0–tau) values. Each marker represents log10 change in plasma DTG Cmin values from period 1 to period 2 in each participant. The black line represents linear regression and the dashed lines represent 95% confidence intervals. Colored markers indicate CYP2B6 metabolizer genotypes as normal (*1/*1) in green, intermediate (*1/*6) in blue, slow (*6/*6) in red, and individuals who did not consent for genetic testing as open circles.

