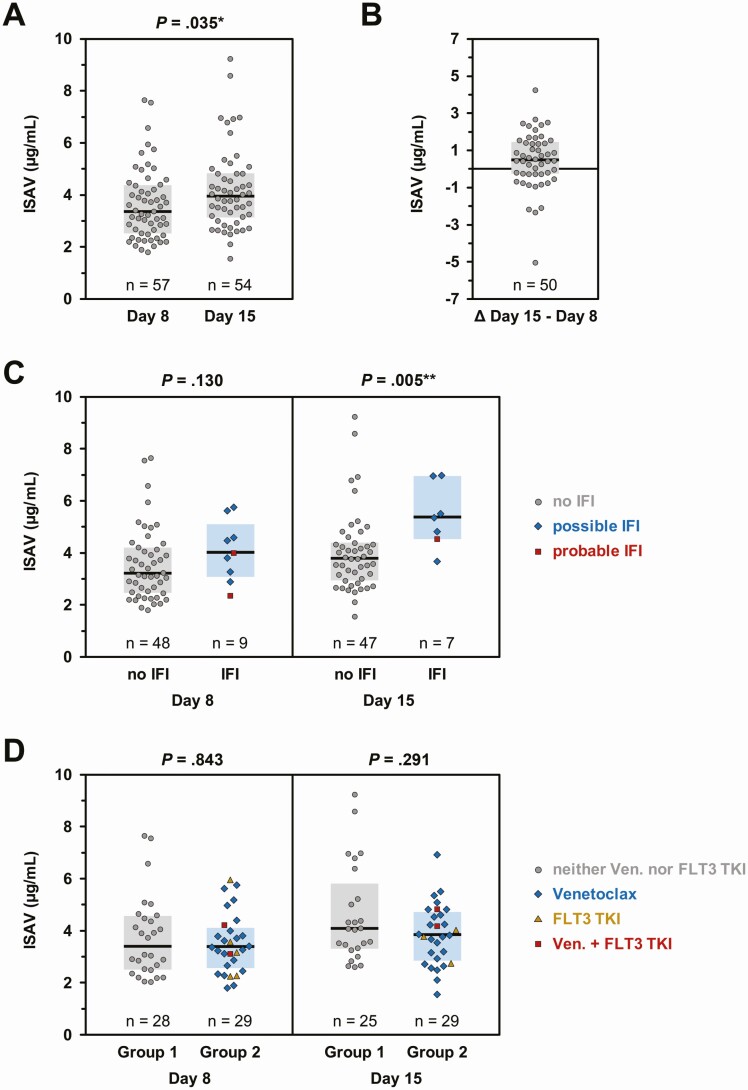
Figure 2.
Isavuconazole (ISAV) trough concentrations on day 8 and day 15. ISAV trough concentrations were measured on days 8 and 15 using a validated liquid chromatography–tandem mass spectrometry assay [16]. A, Trough concentrations were available from 57 patients on day 8 and 54 patients on day 15. B, Matched pairs of day 8 and day 15 ISAV trough concentrations were available in 50 patients. The difference between serum concentrations on day 15 minus day 8 is plotted to document the intraindividual stability of ISAV serum levels. C, Comparison of ISAV trough concentrations on days 8 and 15 relative to the invasive fungal infection status at the time of ISAV discontinuation. D, Comparison of ISAV trough concentrations depending on the patients’ chemotherapy regimen. Group 1: patients receiving neither venetoclax nor FLT3 tyrosine kinase inhibitors (gray circles). Group 2: patients receiving venetoclax (blue diamonds), FLT3 tyrosine kinase inhibitors (golden triangles), or both (red squares). For all panels, individual values, median (horizontal bars), and interquartile range (colored boxes) are shown. A, C, and D, Mann-Whitney U test. Significance levels are denoted by asterisks: *P < .05, **P < .01. Abbreviations: IFI, invasive fungal infection; TKI, tyrosine kinase inhibitor; Ven., venetoclax.

