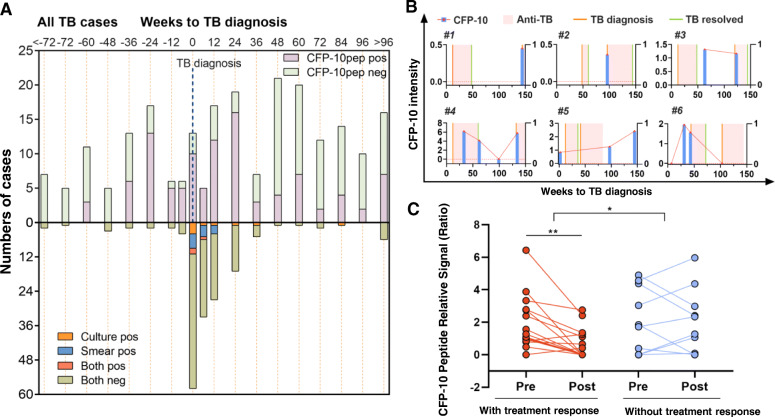
Fig. 3.
Serum CFP-10pep assay in early detection, recurrent TB, and TB treatment monitoring. a Distribution of CFP-10pep-positive and CFP-10pep-negative signal (above the x-axis) and culture and/or smear positive and culture + smear negative results (below the x-axis) in total TB cases, where time zero (vertical dashed line) denotes time of TB diagnosis. Only one sample per child was available and evaluated in each 12-week interval. b Recurrent TB cases. The orange vertical lines denote time of TB diagnosis relative to study enrollment, the pink box indicates the duration of an anti-TB treatment, and the vertical green lines indicate the time of TB resolution, while the red dots and blue bar connected by red lines indicate the time and intensity of serum CFP-10pep signal. c Serum CFP-10pep signal changes from pre-diagnosis (pre) to post-diagnosis (post) in TB cases with (red dots) and without (blue dots) positive anti-TB treatment responses. Connected points indicate the magnitude and time frame of changes for individual patients. **p < 0.01 by paired t test, *p < 0.05 by repeated measure mixed model to compare the paired difference between TB cases with and without positive anti-TB treatment responses

