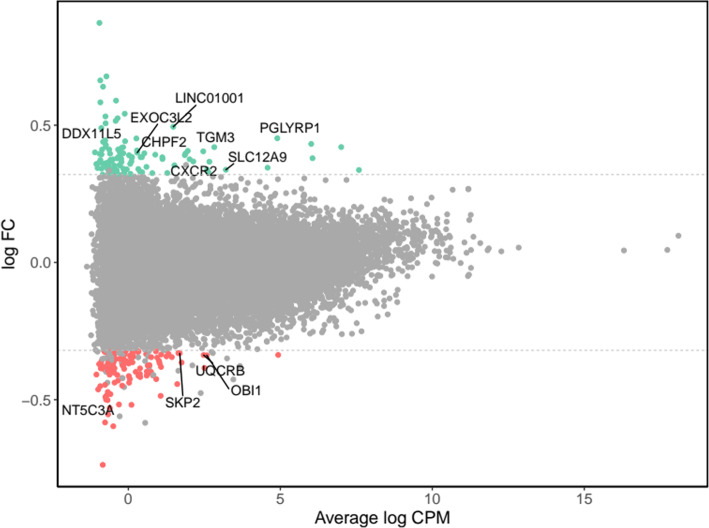
Fig. 3.
Global gene expression change between pre- and post-supplementation states in the blueberry group. MA plot shows the log2 average abundance of transcripts in counts per million mapped reads (log CPM) on the x-axis and the log2-fold change (log FC) on the y-axis. Non-significant genes are represented by grey dots. Over- and under-expressed genes (FC > 1.25) with unadjusted significant differences (paired t test P value < 0.05) are coloured in green and red, respectively. Significant differentially expressed genes from paired t tests (FDR-adjusted P value < 0.05) and showing at least a 1.25 FC are labelled with gene names. The dashed lines represent 1.25 FC

