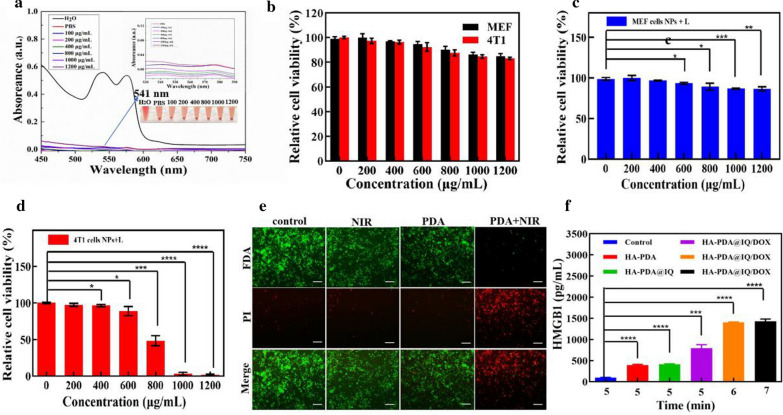
Fig. 4.
a Hemolytical activity of the HA-PDA@IQ at different concentrations. PBS and water were used as negative and positive control, respectively. b Cell viability of 4T1 cells and MEF cells co-cultured with different concentrations of HA-PDA@IQ NPs for 48 h. c Relative viability of 4T1 cells and d MEF cells after HA-PDA@IQ NPs upon laser irradiation (2 W/cm2, 5 min) at various concentrations. e Fluorescent images of 4T1 cells in different treatment groups by live (green) and dead (red) cell staining. Scale bar:100 μm. f The release of HMGB1 in different treatment groups. p values were calculated by the Student’s t test. Mean ± SD (n = 4) of three independent experiments, *p < 0.05, **p < 0.01, ***p < 0.001, ****p < 0.001

