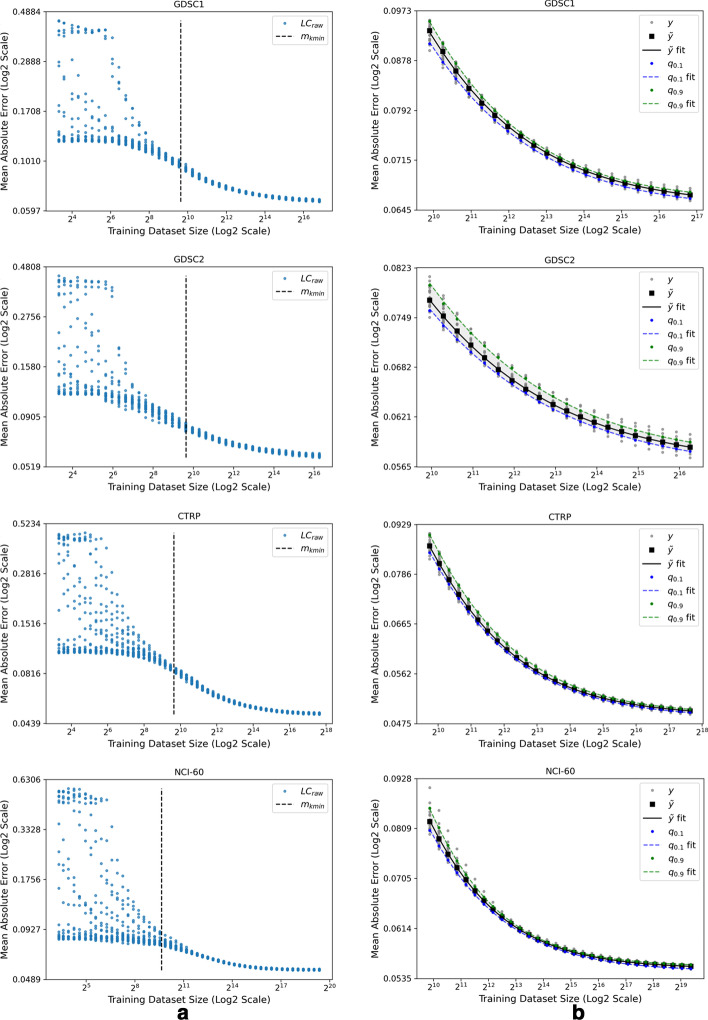
Fig. 5.
Learning curves generated by using dGBDT for multiple data splits of each of the datasets in Table 1. a The entire set of learning curve scores, , where each data point is the mean absolute error of predictions computed on test set E as a function of the training set size . A subset of scores in which the sample size is above (dashed black line) was considered for curve fitting. b Three curves were generated to represent the fit: (blue curve) and (green curve) representing the variability of the fit, and (black curve) representing the learning curve fit

