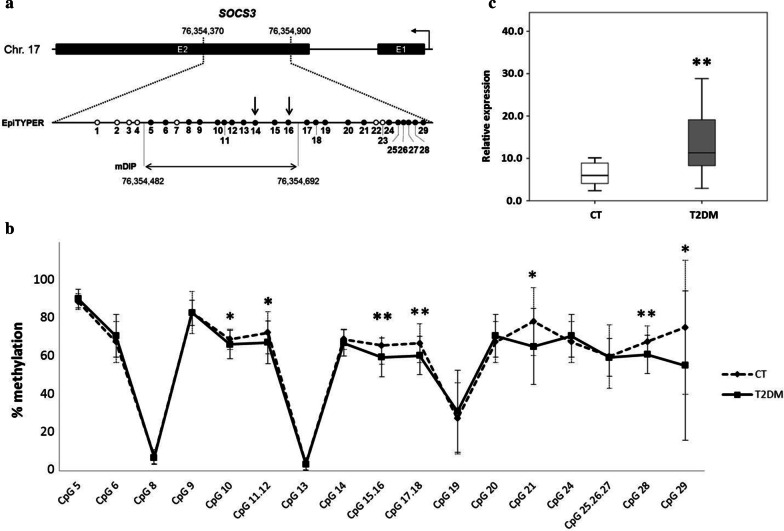
Fig. 4.
DNA methylation and gene expression profiles of SOCS3 in control and T2DM individuals. (a) Schematic representation of the CpG sites distribution within the DNA region under investigation in the SOCS3 locus. The image indicates the location and extent of the region analysed in the EpiTYPER assay (filled and empty circles represent the analysed and unanalysed CpG sites, respectively) and the PCR amplicon used in the modified DNA immunoprecipitation assay (mDIP). The arrows indicate the CpG sites analysed in the methylation-sensitive PCR assay. Filled boxes represent exons. The genomic positions refer to the 2009 (GRCh37/hg19) genome assembly. (b) SOCS3 CpG methylation percentage in T2DM patients and controls. Data are mean ± SD. *p ≤ 0.05, **p ≤ 0.01 (Student t-test). (c) Box-whisker plots of SOCS3 mRNA levels in T2DM patients and controls. Boxes show the median, the 25th and the 75th percentiles. Whiskers show the minimum and the maximum data point. **p ≤ 0.01 (Student t-test). N = 48 CT, 61 T2DM

