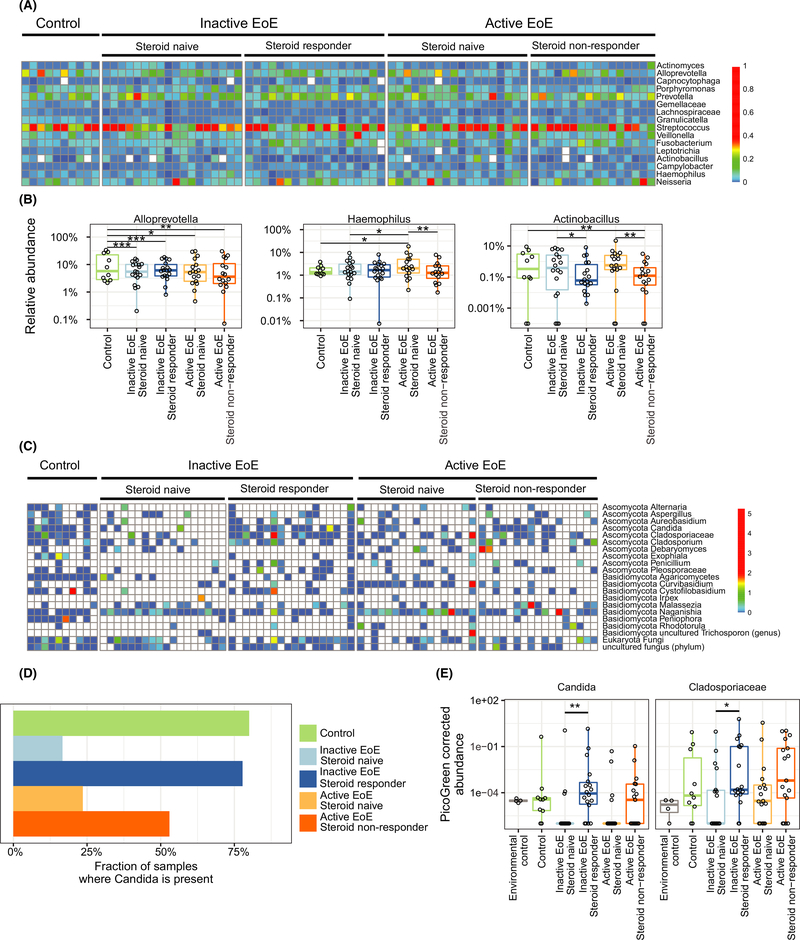
FIGURE 1.
Alterations in bacterial and fungal communities in esophageal samples of patients with EoE and non-EoE controls. A, Heatmap of the bacterial composition. Colors represent the relative abundance of a taxon. B, Relative abundance of Alloprevotella, Haemophilus, and Actinobacillus. Haemophilus showed significant differences between control and EoE steroid-naïve subjects. C, Heatmap of the fungal composition. Colors represent PicoGreen-corrected operational taxonomic unit (OTU) abundances. D, Fraction of samples where the fungal genus Candida is present. E, PicoGreen-corrected OTU abundances of Candida and Cladospiraceae

