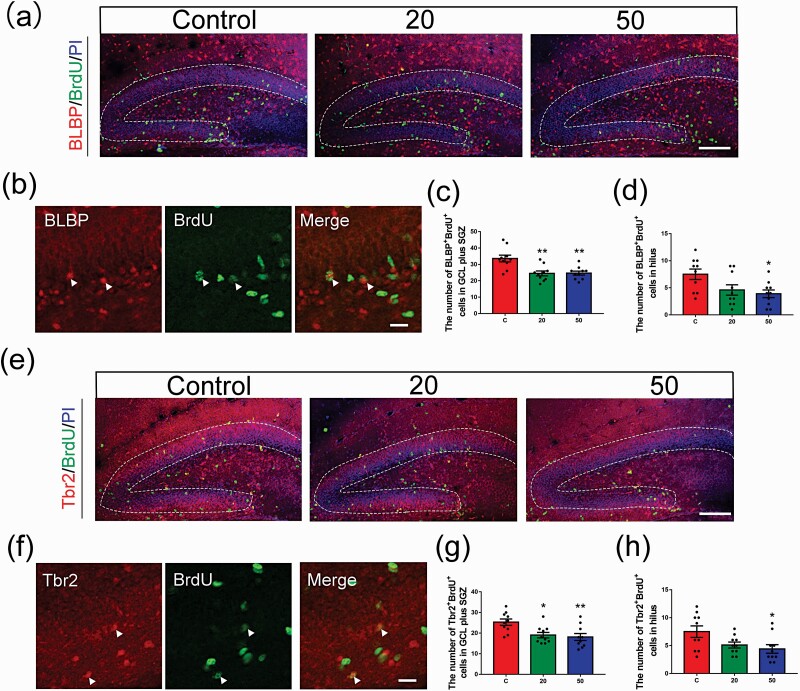
Figure 3.
Effects of gossypol exposure on the proliferation of RGCs and IPCs in the DG. (a) Representative images of proliferating RGCs labeled with BrdU (green) and BLBP (red) in the DG at 2 hours after BrdU injection at P8. Brain sections were counterstained with PI (blue). (b) Higher magnification of proliferating RGCs (white arrows). (c) Quantification of the number of BLBP+ BrdU+ cells in the GCL plus SGZ. (d) Quantification of the number of BLBP+ BrdU+ cells in the hilus. Gossypol decreased the number of BLBP+ BrdU+ cells. (e) Representative images of proliferating IPCs labeled with BrdU (green) and Tbr2 (red) in the DG at 2 hours after BrdU injection at P8. Brain sections were counterstained with PI (blue). (f) Higher magnification of proliferating IPCs (white arrows). (g) Quantification of the number of Tbr2+ BrdU+ cells in the GCL plus SGZ. (h) Quantification of the number of Tbr2+ BrdU+ cells in the hilus. Gossypol decreased the number of Tbr2+ BrdU+ cells. Data represent the mean ± SEM (n = 10 per group, 10 sections from 5 offspring in each group). Scale bars = 100 μm. *P < .05 and **P < .01 compared with the controls.

