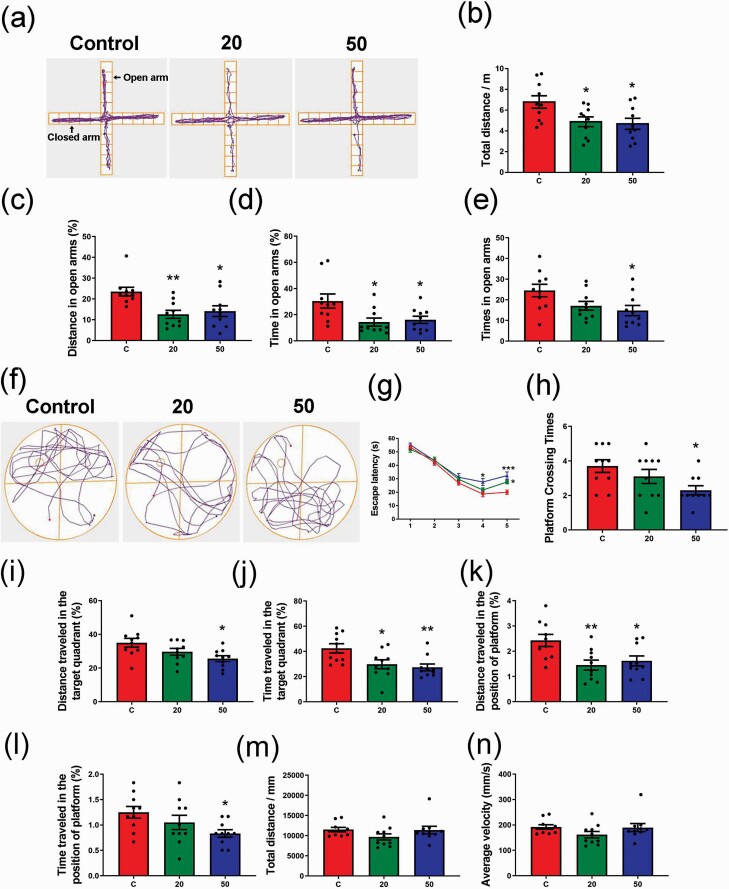
Figure 6.
Effects of gossypol exposure on anxiety-like behaviors, memory, and learning. (a) Trace chart of elevated plus maze tests of offspring at P21. The blue point represents the original position, and the red point represents the end position. Quantitative analysis of total distance (b), distance (c), time (d), and time traveled (e) in the open arms. There were differences between the gossypol exposure and control groups. (f) Trace chart of Morris water maze tests of offspring at P21. The blue point represents the original position, and the red point represents the end position. Quantitative analysis of escape latency (g), times of crossing the platform (h), distance and time traveled in the target quadrant (i–j), distance and time traveled in the position of platform (k–l), total distance (m), and average velocity (n). There were differences between the gossypol exposure and control groups. Data represent the mean ± SEM (n = 10 per group, 10 offspring from 5 dams in each group). *P < .05 and **P < .01 compared with the controls.

