
Figure 2.
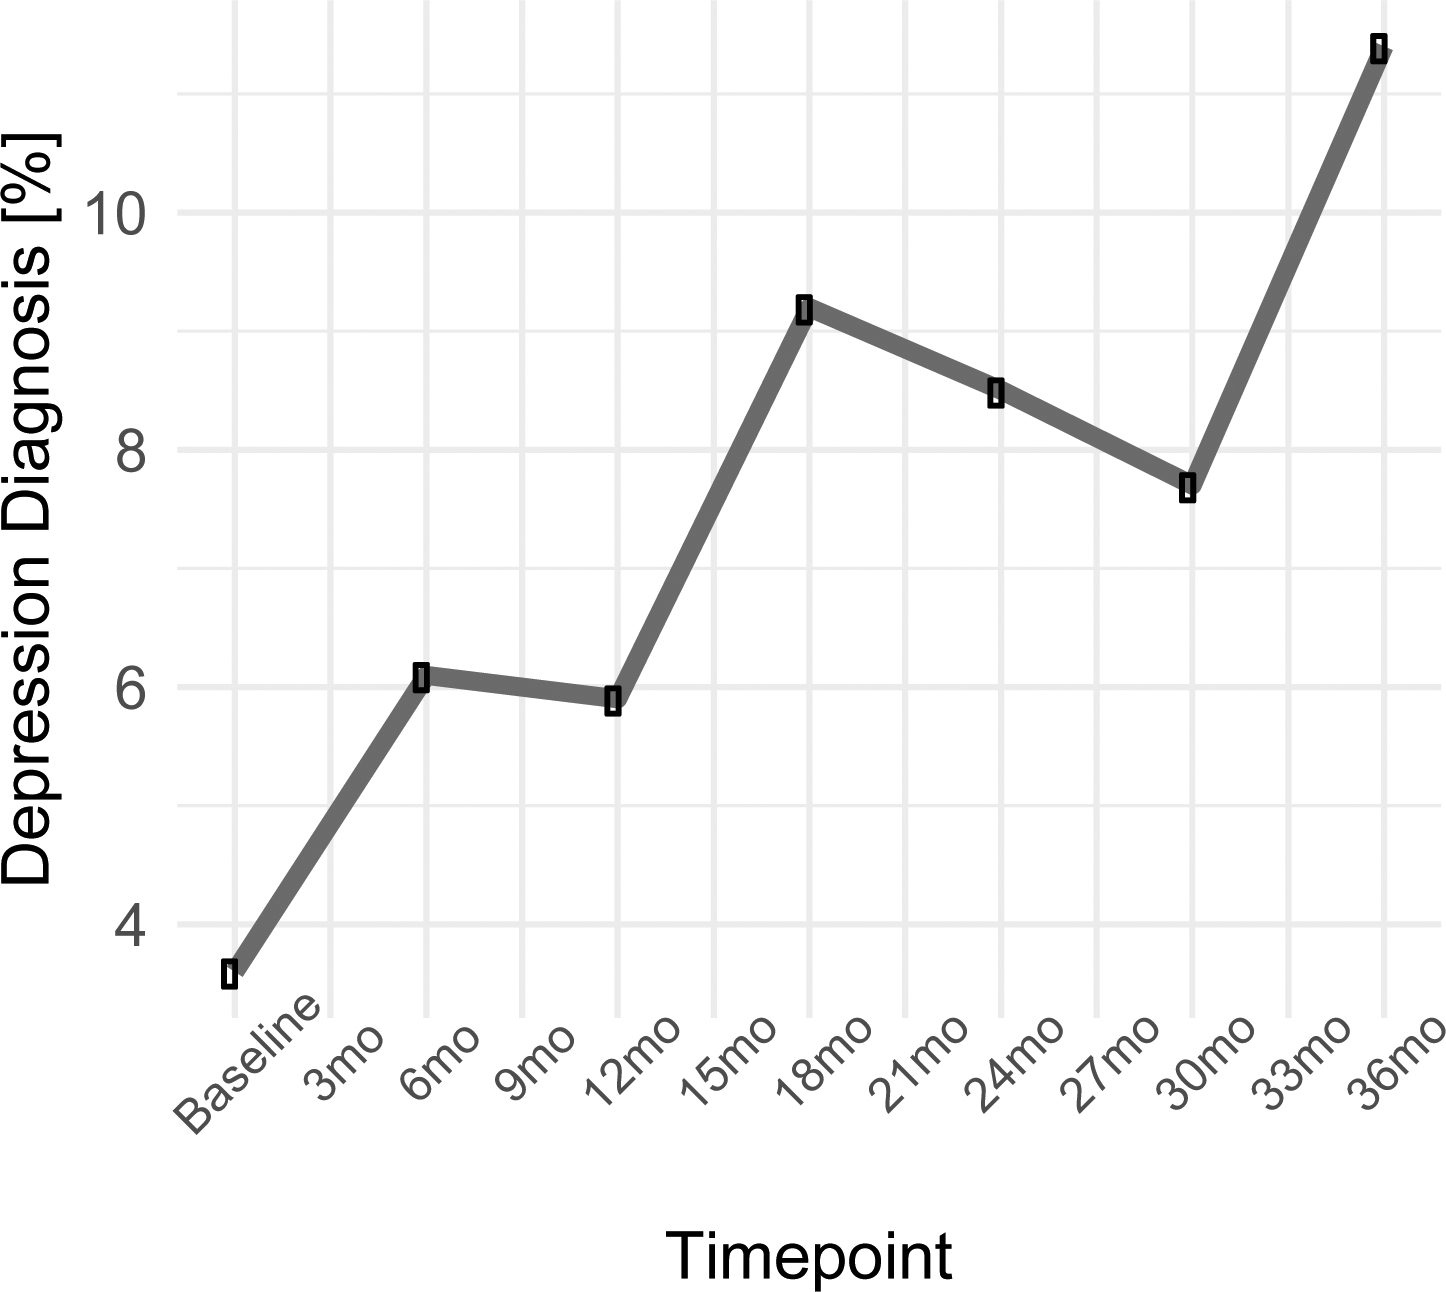
Percentage of sample meeting depression diagnostic criteria over time.
Note: Figure 2 depicts the average trajectory of depression diagnoses in percentages using the K-SADS from baseline to the 36-month follow-up assessment
Official websites use .gov
A
.gov website belongs to an official
government organization in the United States.
Secure .gov websites use HTTPS
A lock (
) or https:// means you've safely
connected to the .gov website. Share sensitive
information only on official, secure websites.
Percentage of sample meeting depression diagnostic criteria over time.
Note: Figure 2 depicts the average trajectory of depression diagnoses in percentages using the K-SADS from baseline to the 36-month follow-up assessment