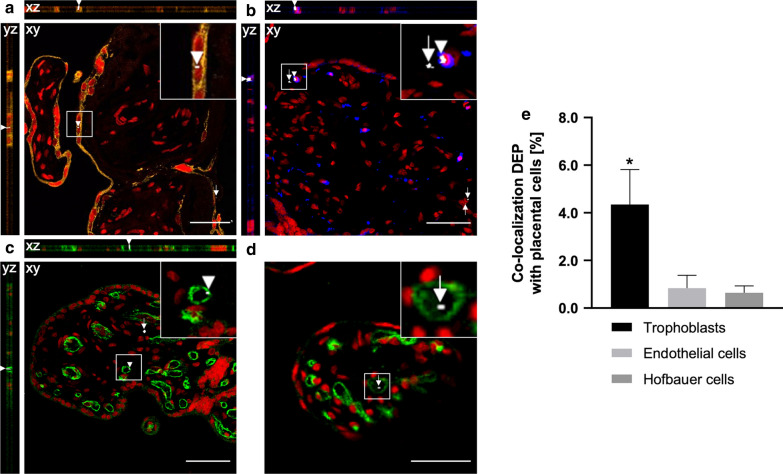
Fig. 5.
Uptake and localization of carbon particles in placental villous tissue. Orthogonal views and images of placental tissue sections after 6 h of perfusion with 0.45 μg/mL DEPs (a–d). Trophoblast cells are stained with anti-cytokeratin (AE1/AE3, orange) (a), placental macrophages with anti-CD68 (blue) (b) and endothelial cells with anti-CD31 (green) (c, d). Syto 61 Red (red) was used as a nuclear counterstain (a–d). Few carbon particles are also detected inside fetal microvessels (d). The carbon particles are imaged under femtosecond pulsed illumination (white; arrowheads and arrows indicate carbon particles colocalized or not with the stained cell type, respectively). Approximately 22 images with a 512 × 512-pixel resolution were acquired throughout the stained placental section with an optical slice thickness of 1 µm using a pixel dwell time of 4.10 µs. xz and yz represent cross-sectional views of the optical volume corresponding to the image stack collected from a colocalized particle. Presented images are representative of all investigated samples. Scale bars: 30 µm (a), 50 µm (b, c), and 20 µm (d). The number of detected particles colocalized with a specific cell type was quantified using the Manders’ coefficient (e). Data represent the colocalization coefficient (SD) of four independently perfused placentae with medium containing 0.45 µg/mL DEPs (225 images/placenta/cell type). One-way ANOVA with Tukey’s multiple comparison correction is performed to find significance in the percentage colocalization between the different cell types, *p < 0.05 is considered significant. ANOVA analysis of variance, DEP diesel exhaust particle, SD standard deviation

