Fig. 3.
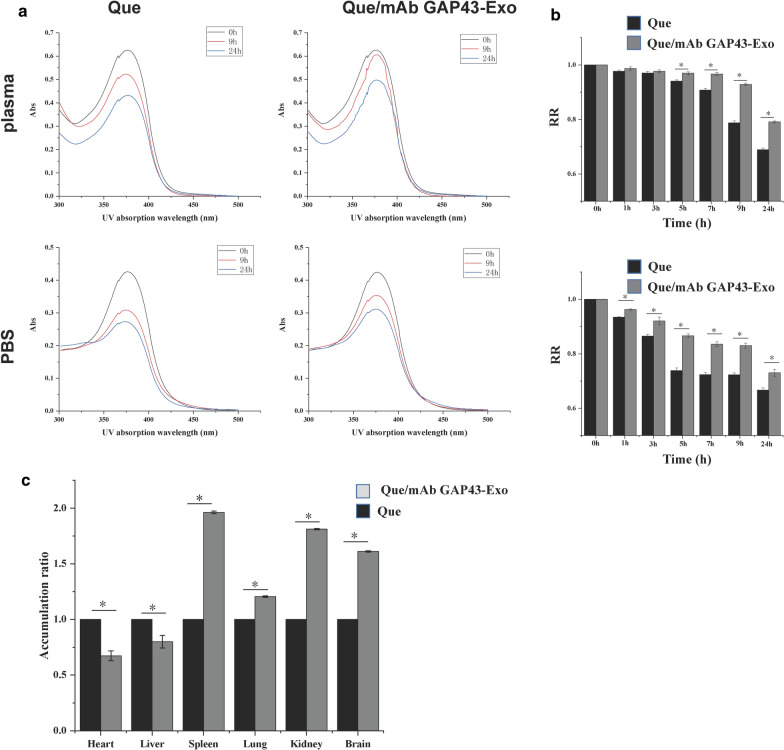
Que/mAb GAP43-Exo enhanced the stability and solubility of Que in vitro. a The UV absorption curve of Que and exosomal Que in PBS and plasma. b The remaining ratio (RR) of Que and exosomal Que in PBS and plasma. Data are expressed as means ± SD (n = 3), *P < 0.05. c Tissue distributions of Que in rats treated with Que and Que/mAb GAP43-Exo at 8 h after single i.v. administration. The accumulation ratio was quantified by comparing the concentrations of exosomal Que in different organs with the concentration of free Que in organs. The accumulation ratio of free Que in organs was set as 1.0. Data are expressed as means ± SD (n = 3), *P < 0.05

