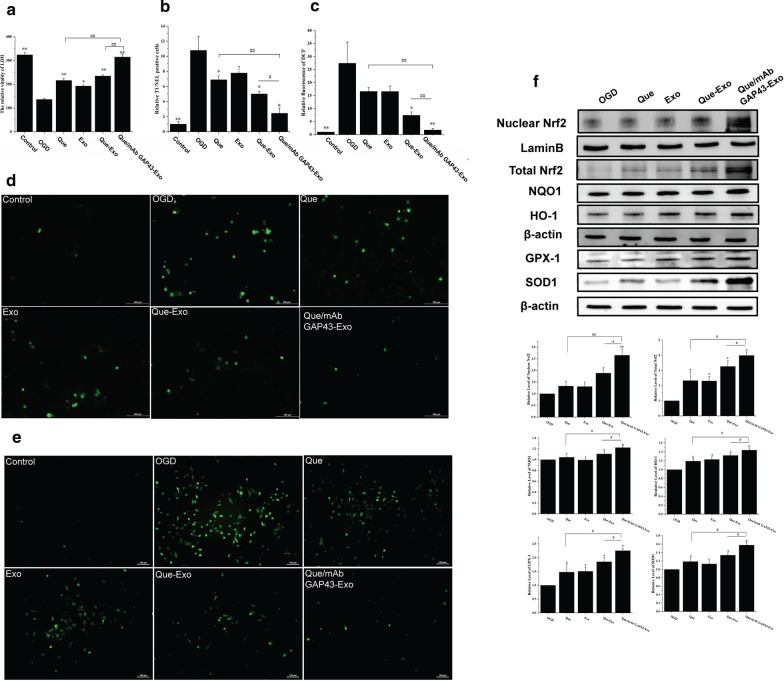
Fig. 5.
Que/mAb GAP43-Exo reduced OGD mediated neuronal injury in vivo. Normal cells were used as the control group. a The effect of LDH in OGD‑induced cells treated with Que, Exo, Que-Exo and Que/mAb GAP43-Exo. Data are expressed as means ± SD (n = 3). *P < 0.05, **P < 0.01, comparing with OGD group, ##P < 0.01. b Relative ratio of TUNEL positive number of OGD cells treated with Que, Exo, Que-Exo and Que/mAb GAP43-Exo. Relative ratio of TUNEL positive number in control group was set as 1.0. Data represent means ± SD (n = 3), *P < 0.05, **P < 0.01, comparing with OGD group, #P < 0.05, ##P < 0.01. c Quantitative relative fluorescence assay of DCF in OGD cells treated with Que, Exo, Que-Exo and Que/mAb GAP43-Exo. Quantitative relative fluorescence density of DCF in control group was set as 1.0. Data represent means ± SD (n = 3), *P < 0.05, **P < 0.01, comparing with OGD group, ##P < 0.01. d Images of apoptotic cells in OGD cells treated with Que, Exo, Que-Exo and Que/mAb GAP43-Exo in TUNEL assay. The scale bar is 100 μm. e Images of ROS generation in OGD cells treated with Que, Exo, Que-Exo and Que/mAb GAP43-Exo. The scale bar is 100 μm. f Western blot and quantitative analysis of the expression levels of Nrf2, NQO-1, HO-1, SOD1 and GPx1 in OGD cells treated with Que, Exo, Que-Exo and Que/mAb GAP43-Exo. Relative expression of protein in OGD group was set as 1.0. Data are expressed as means ± SD (n = 3). *P < 0.05, **P < 0.01, comparing with OGD group, #P < 0.05, ##P < 0.01

