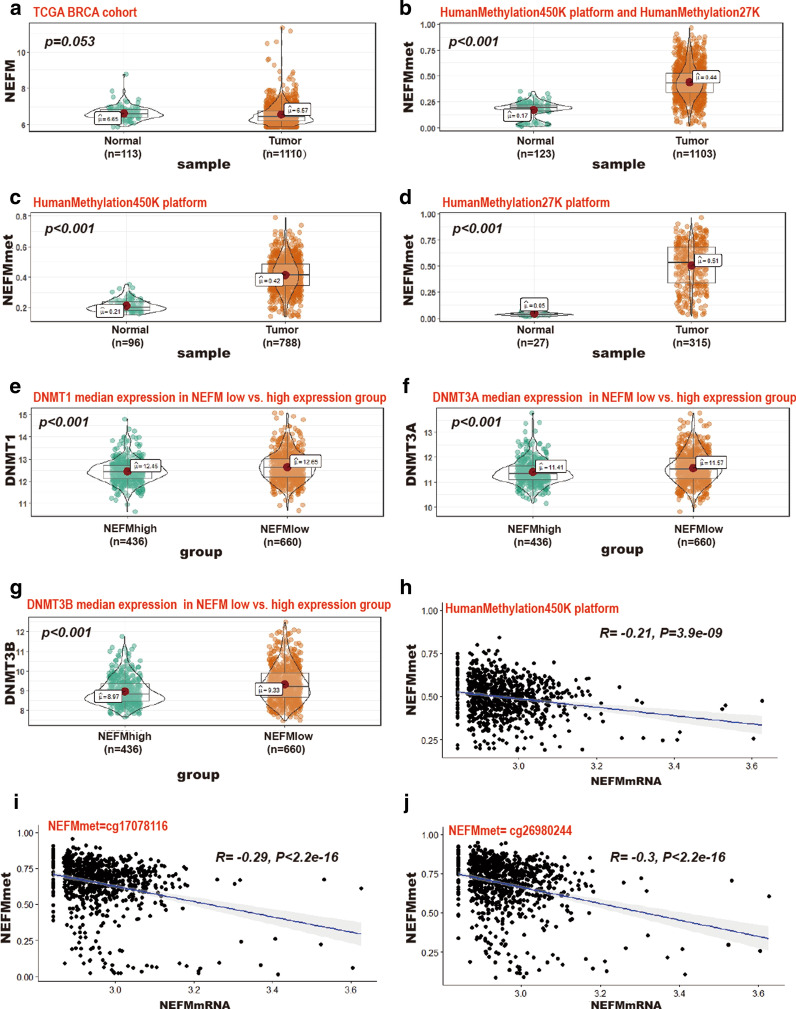
Fig. 3.
The correlation between NEFM transcriptional expression and DNA methylation of NEFM in TCGA BRCA cohort. a NEFM transcriptional expression was downregulated in BRCA compared with normal breast tissue. b–d NEFM DNA methylation was enhanced in BRCA compared with normal breast tissue (b NEFMmet = mean beta value of NEFM DNA methylation using 24 probe of HumanMethylation450K platform and 2 probe of HumanMethylation27K; c NEFMmet = mean beta value of NEFM DNA methylation of HumanMethylation450K platform; d NEFMmet = mean beta value of NEFM DNA methylation of HumanMethylation27K platform). e–g Significant higher DNA methyltransferase was connected with NEFM low expression. e DNMT1 median expression 12.65 vs. 12.45 in NEFM low vs. high-expression group, p < 0.001; f DNMT3A median expression 11.57 vs. 11.41 in NEFM low vs. high-expression group, p < 0.001; g DNMT1 median expression 9.33 vs. 8.97 in NEFM low- vs. high-expression group, p < 0.001). h–j. DNA methylation of NEFM inversely correlated with NEFM expression. h NEFMmet = log2 mean beta value of NEFM DNA methylation of 24 probe of HumanMethylation450K platform, HR = − 0.21, p = 3.9e−09; i NEFMmet = log2 beta value of cg17078116 probe, HR = − 0.29, p < 2.2e−16; j NEFMmet = log2 beta value of cg26980244 probe, HR = − 0.30, p < 2.2e−16

