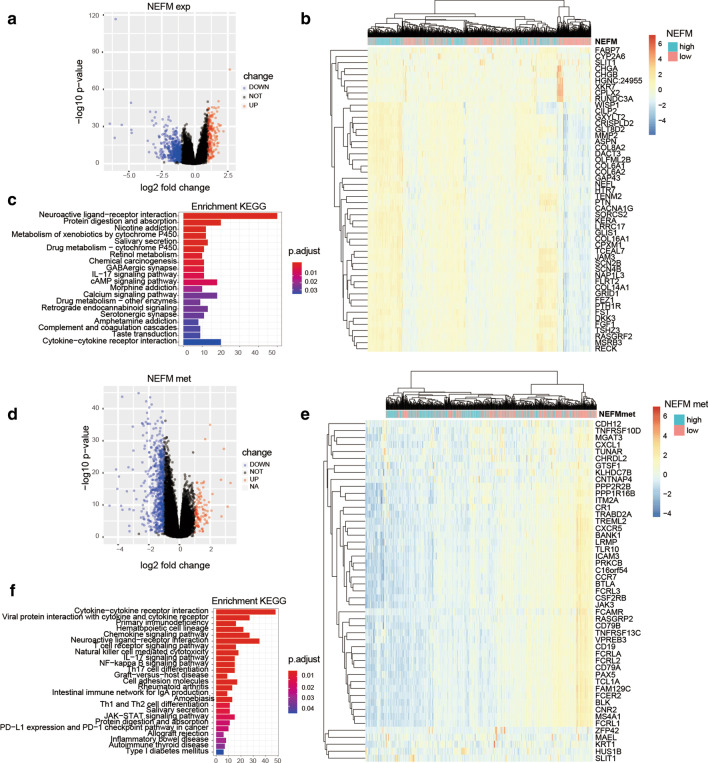
Fig. 4.
Genes and pathways connected with NEFM transcriptional expression/DNA methylation in TCGA BRCA cohort. a Volcano plot of differentially expressed gene profiles between NEFM high-expression group and NEFM low-expression group (absolute log2 (fold change) > 1, adjp < 0.05). b Expression heatmap of the top 50 NEFM-associated genes. The top curve described NEFM's expression distribution of 1096 BRCA samples. c Bar plot of the NEFM expression_related signaling pathways derived from KEGG Eenrichment analysis. d Volcano plot of differentially expressed gene profiles between NEFM high DNA methylation group and NEFM low DNA methylation group (absolute log2 (fold change) > 1, adjp < 0.05). e Expression heatmap of the top 50 NEFM DNA methylation-associated genes. The top curve described NEFM methylation distribution of 691 BRCA samples. f Bar plot of NEFM methylation-related signaling pathways derived from KEGG enrich analysis

