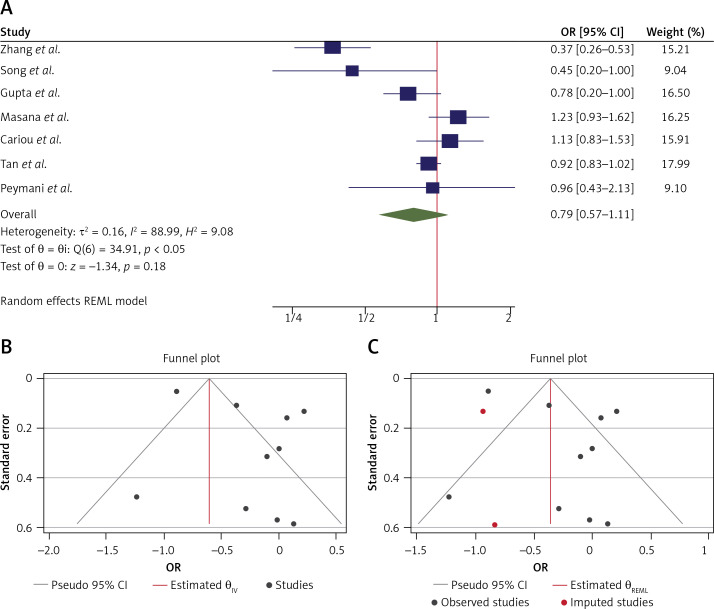
Figure 2.
A – Forest plot of individual effect sizes within each study for ICU admission outcome. The overall effect is shown by the green symbol. B – Funnel plot showing publication bias for ICU admission outcome. C – Extending the results using the nonparametric trim and fill method to account for publication bias. Two additional studies were included in this analysis (shown in red)

