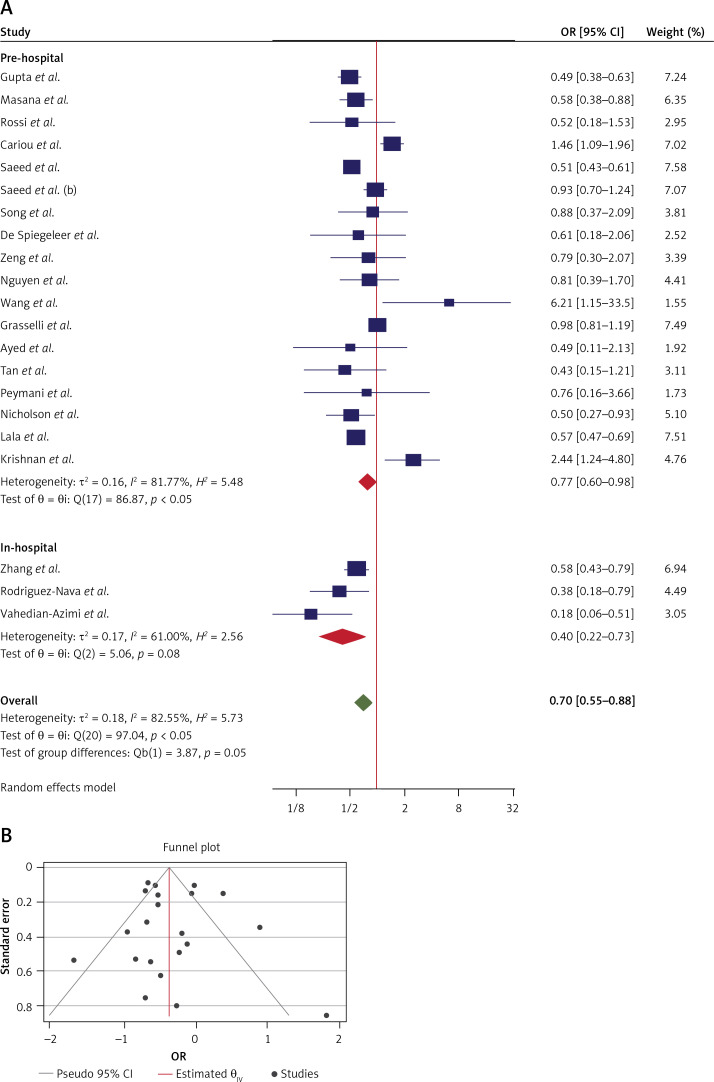
Figure 4.
A – Forest plot showing the effect across the studies assessing pre-hospital (n = 18) and in-hospital (n = 3) use of statins for the death outcome (overall for each subgroup shown as red symbols). The overall effect is shown by the green symbol. B – Funnel plot showing the publication bias for all 21 studies which assessed the death outcome

