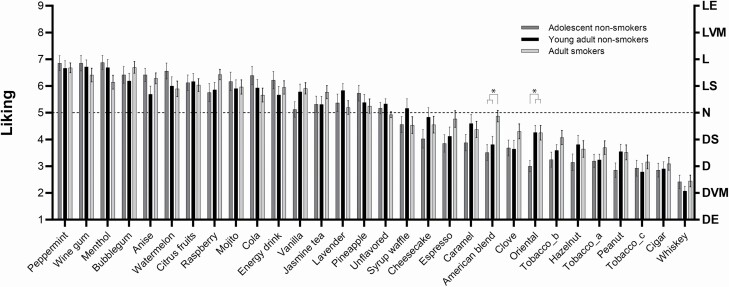
Figure 1.
Mean liking ratings for individual e-liquids (n = 30), assessed by adolescent nonsmokers, young adult nonsmokers, and adult smokers. Products were ranked from highest to lowest mean liking score across all users (n = 139). The letters on the right y axis represent the categories of the 9-point hedonic scale: DE, dislike extremely; DVM, dislike very much; D, dislike; DS, dislike slightly; N, neither like nor dislike; LS, like slightly; L, like; LVM, like very much; LE, like extremely. Vertical bars represent standard errors of the mean. Significant differences between user groups are indicated with an asterisk (*). The same data are presented in Supplementary Appendix Table A2.

