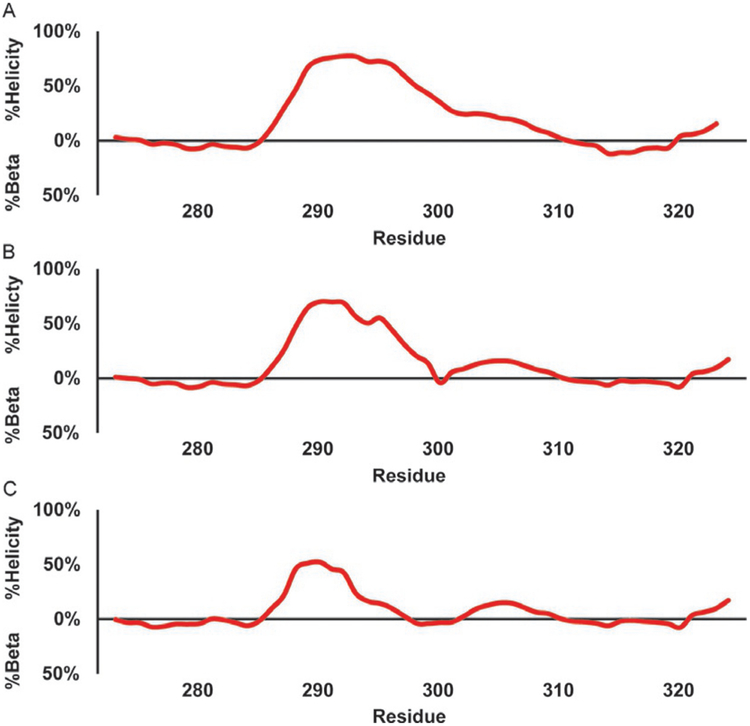
Fig. 13.
Estimation of secondary structure populations for c-Myb TAD using NcSPC. The red line traces the secondary structure population estimate with values greater than zero indicating helical populations and values less than zero indicating beta populations. (A) c-Myb TAD WT, (B) c-Myb TAD L300G, and (C) c-Myb TAD L300P.

