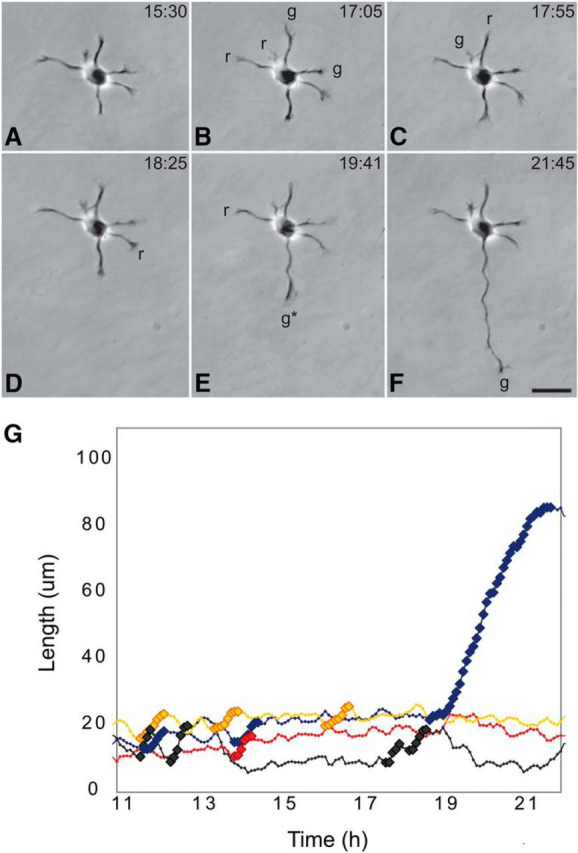
Figure 2.

Axonal specification is marked by a profound change in the pattern of neurite growth and retraction. A–F, Single frames from a time lapse recording illustrating phases of growth and retraction during Stage 2 and Stage 3 of development. Before the axon formed, different minor neurites exhibited periods of growth (g) followed by periods of retraction (r). Eventually, one process began to grow (*) and did not retract, but instead developed into the axon. The times shown refer to hours and minutes after plating. G, Graph representing changes in the length of four different neurites from this same cell before and after axon specification. Bold symbols indicate growth spurts. The x axis shows time after plating. This figure, showing data collected since our original work, offers a clearer view of these events, thanks to improved imaging equipment and the availability of Adobe Photoshop (Teresa Esch, unpublished observations).
