Figure 1.
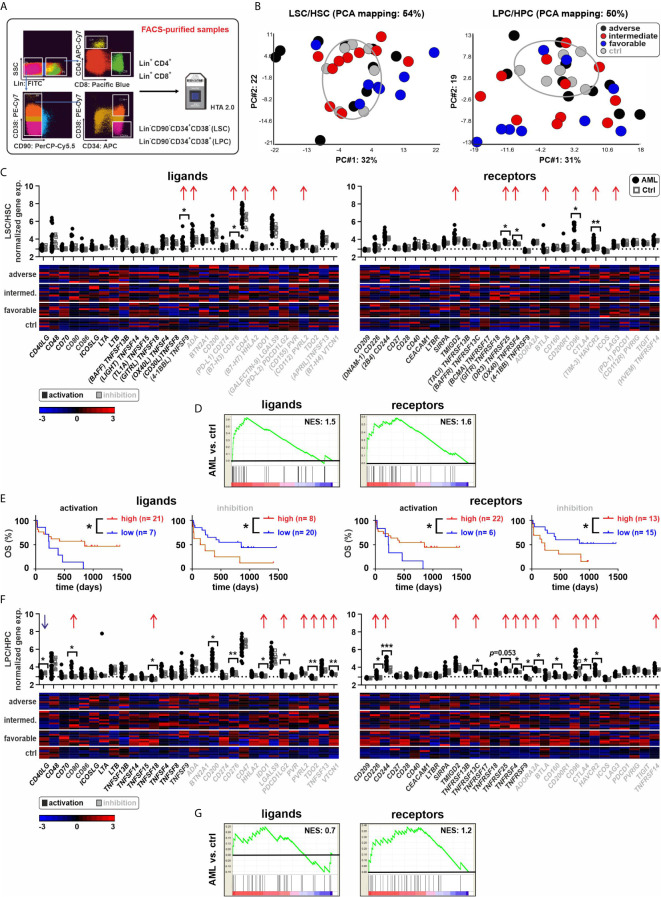
Expression of ICs in AML stem and progenitor cells. (A) Experimental setup. Leukemia stem or progenitor cells (LSCs/LPCs), control hematopoietic stem or progenitor cells (HSCs/HPCs), and paired T cells were FACS-purified. (B) PCA of LSCs/HSCs and LPCs/HPCs from AML patients and controls. (C) Gene expression patterns of ICs in AML LSCs compared to controls (30 ligands and 30 receptors). Dot plots show the gene expression profiles (red arrows showing upregulated ICs and blue arrows indicating downregulated ICs; Fold difference ≥ 1.3). Heatmaps illustrate the expression patterns in respective AML risk groups. (D) Gene set enrichment analysis (GSEA) representing the normalized enrichment score (NES) of IC gene sets on LSCs (AML vs. ctrl). (E) Kaplan–Meier plots of overall survival (OS) for AML patients in the study cohort according to the gene expression signature of activating or inhibitory ICs in LSCs. (F) Gene expression patterns of ICs in AML LPCs compared to controls. Dot plots show the gene expression profiles and heatmaps illustrate the expression patterns in respective AML risk groups. (G) GSEA representing the NES of IC gene sets on LPCs (AML vs. ctrl). Statistics: student’s t-test and log-rank test. *P < 0.05, **P < 0.01, ***P < 0.001.

