Figure 4:

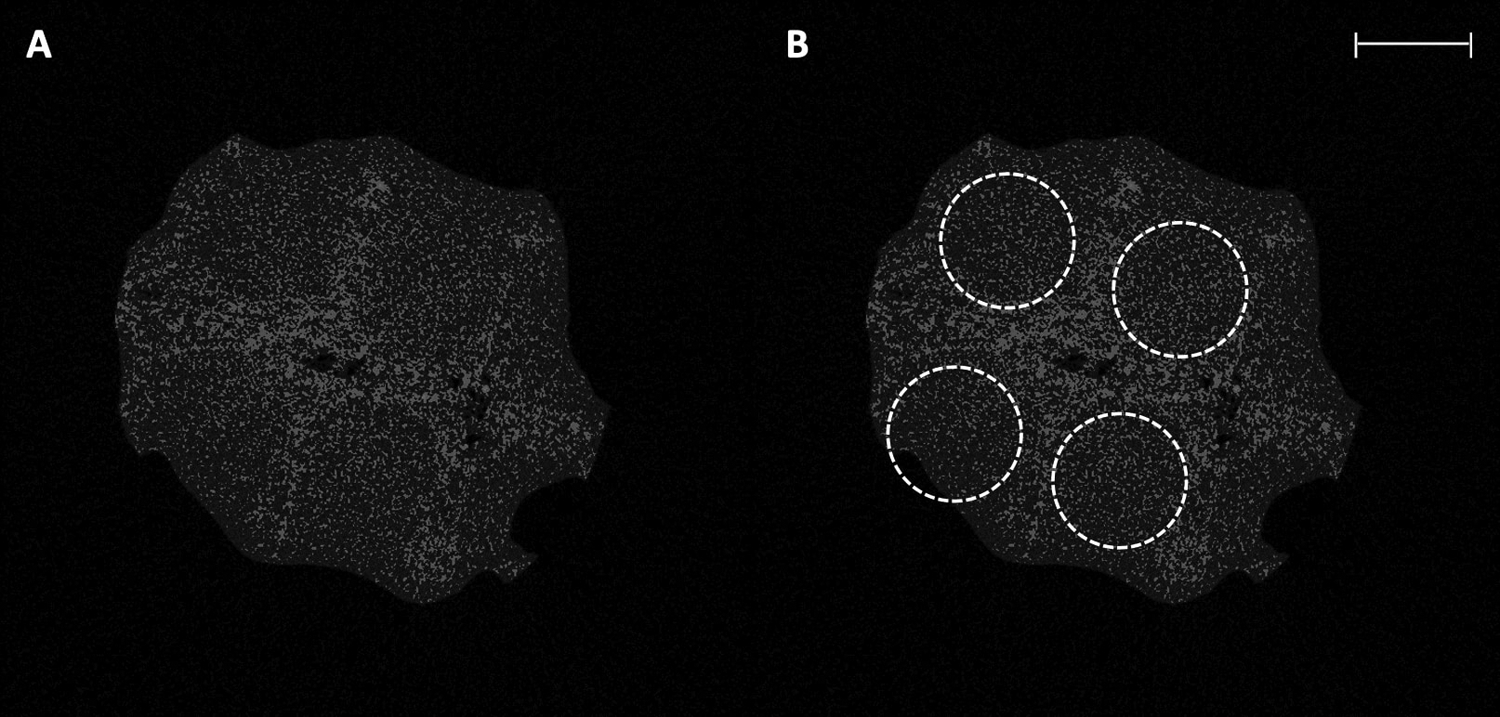
A – μCT image of scaffold slice demonstrating homogenous tissue ingrowth throughout scaffold pores. B – The same μCT image with scaffold pores outlined. Scale bar represents 2 mm.

A – μCT image of scaffold slice demonstrating homogenous tissue ingrowth throughout scaffold pores. B – The same μCT image with scaffold pores outlined. Scale bar represents 2 mm.