Figure 9.

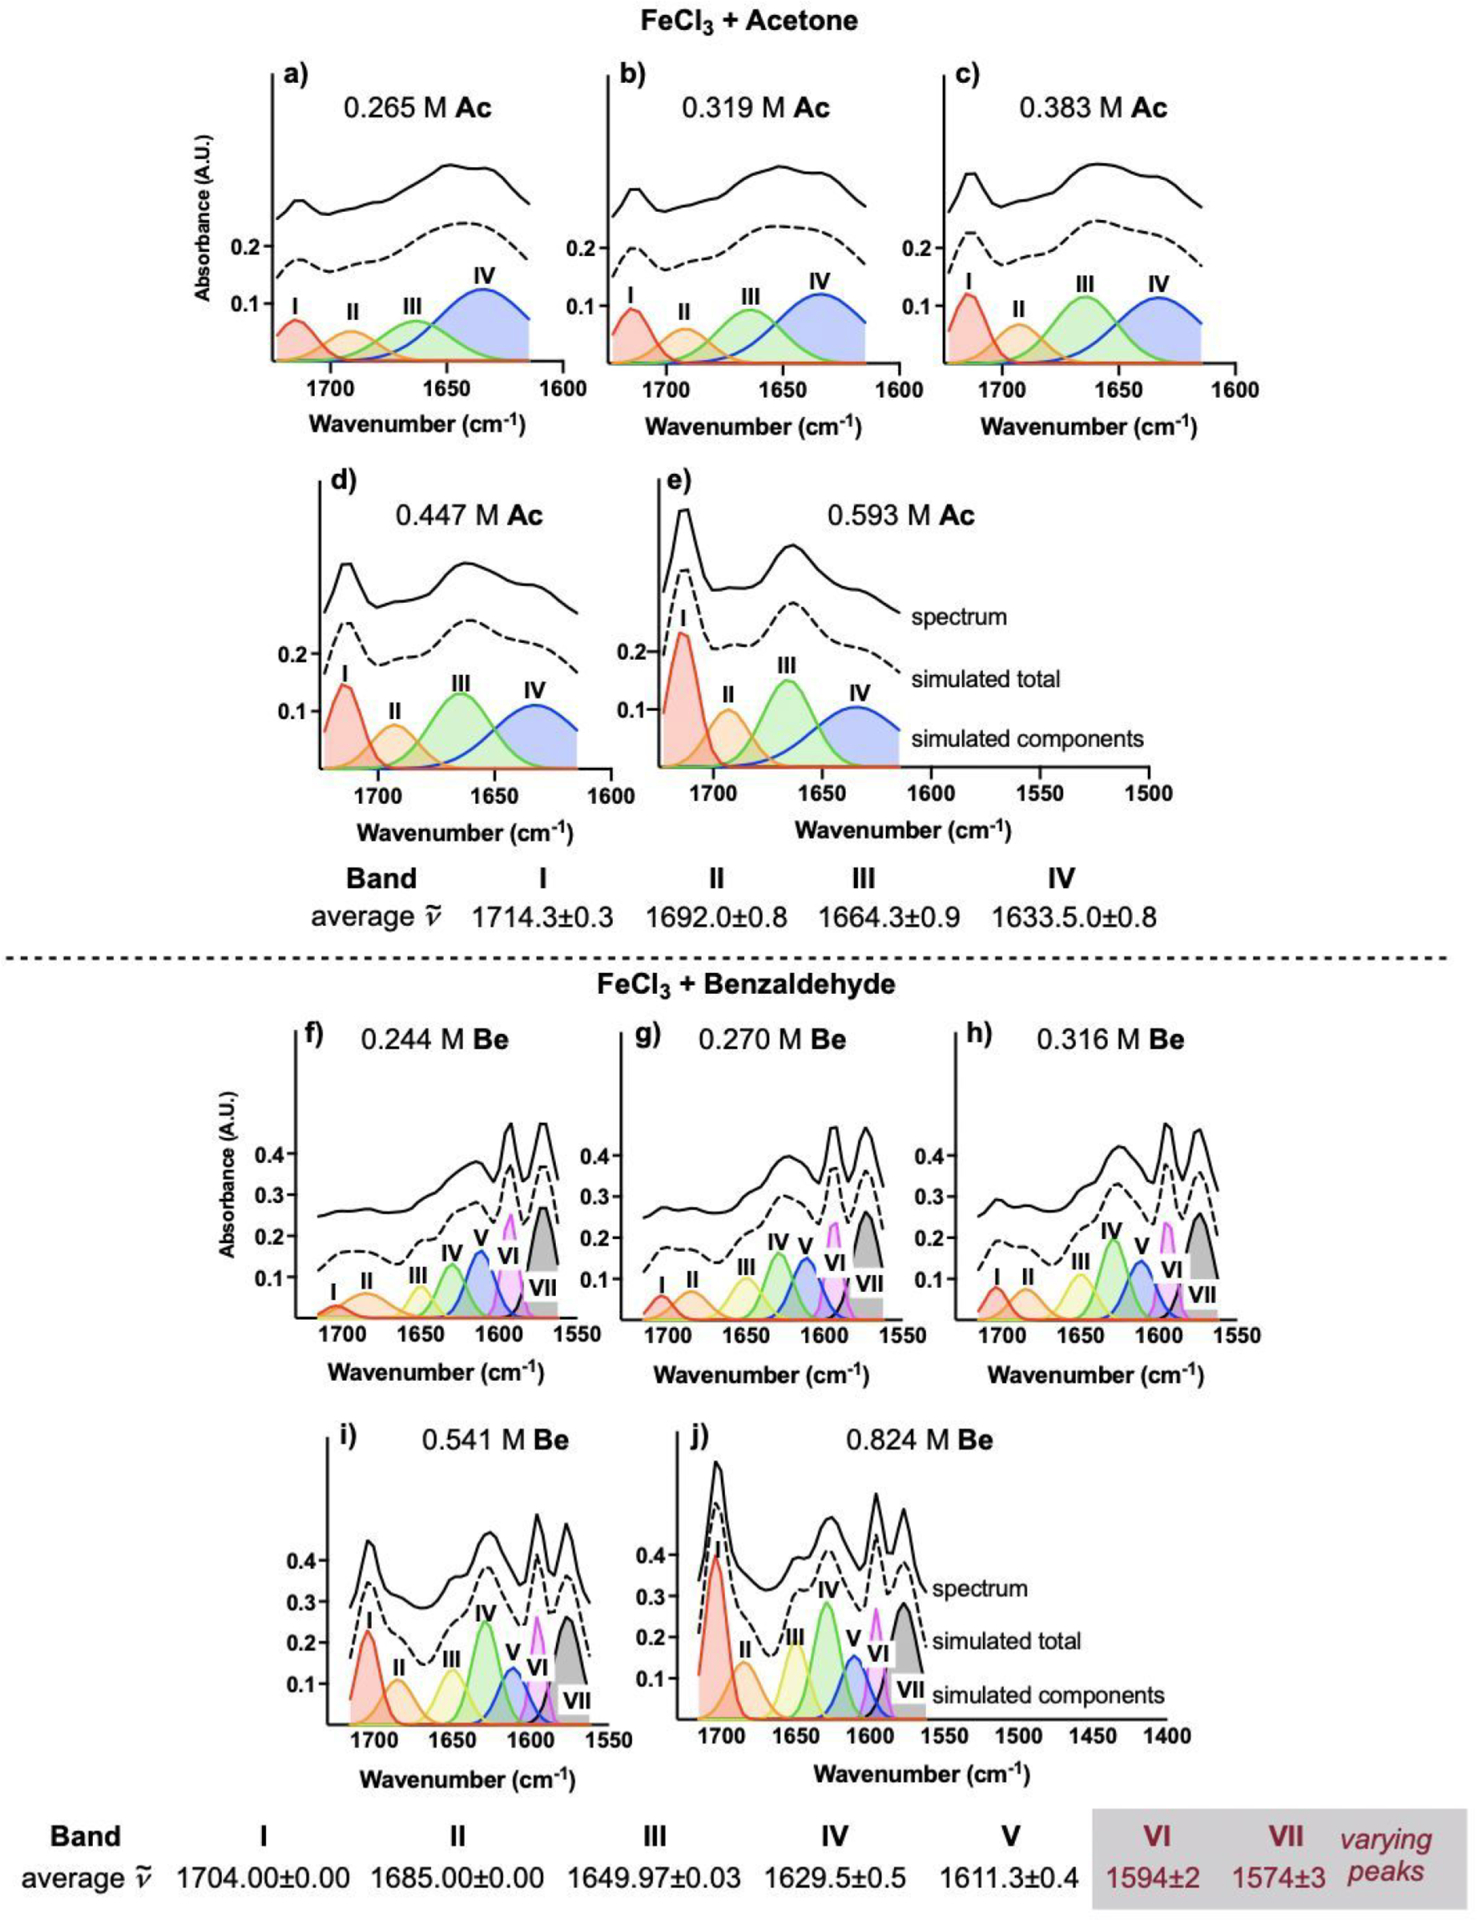
Stacked plots of spectral deconvolution of titration of Fc (2 mmol in 12 mL DCE) with Ac (top) and titration of Fc (2 mmol in 12 mL DCE) with Be (bottom). Depicted y-axes list absorbance for simulated components.

Stacked plots of spectral deconvolution of titration of Fc (2 mmol in 12 mL DCE) with Ac (top) and titration of Fc (2 mmol in 12 mL DCE) with Be (bottom). Depicted y-axes list absorbance for simulated components.