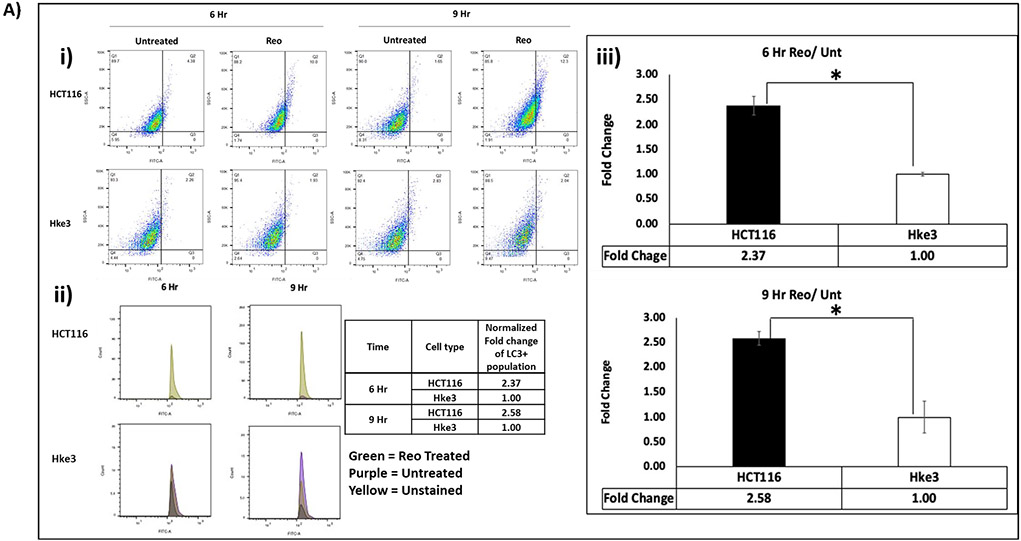
Figure 2A: Expression-level difference of LC3 A/B in human CRC cell lines.
Flow cytometry analysis (Flo Jo 9.2) detected higher fold change of LC3 A/B in HCT116 in comparison to Hke3 at 6 and 9 hours (p<0.05) i) The dot plot ii) Histogram iii) Graphical representation. Cells were stained for LC3 A/B and detected through FITC channel. The fold change of each cell line was obtained by normalizing the pelareorep treated samples to the untreated counterparts (n=4).

