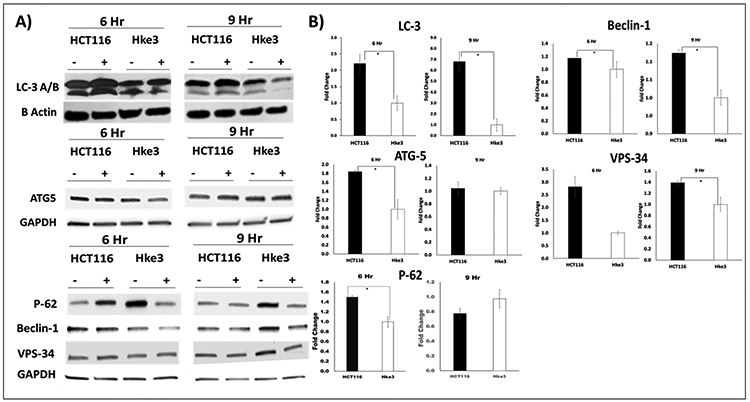
Figure 3A and 3B: Expression of autophagy related proteins in untreated (−) and Pelareorep treated (+) HCT116 and Hke3 samples at 6 and 9 hours.

A) The western portrayed the protein expression of autophagy related protein: LC3 A/B, ATG-5, P-62, Beclin-1, and VPS-34 on the left. B) The corresponding densitometry analysis showing fold change of pelareorep treated to untreated are on the right (n= 3).
