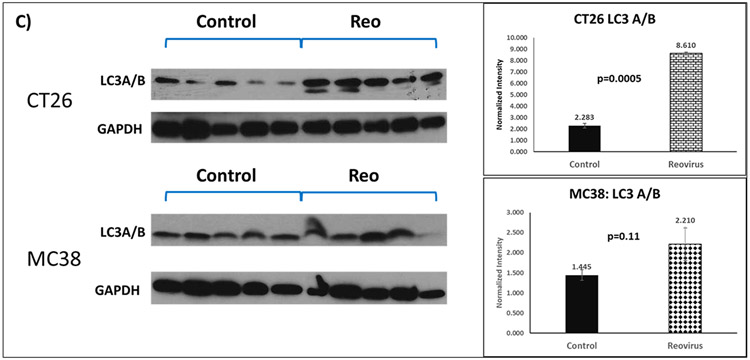
Figure 3C: Western blot analysis of total LC3 expression in CT26 and MC38-mice xenograft tumor in the untreated (Control) or pelareorep Treated group. (Left) The graphical depiction of the protein expression of LC3 I and II. (Right).
The corresponding densitometry showing normalized overall LC3 expression in control and Pelareorep treated groups of either CT26 or MC38 (n=5 for each group). For CT26, the control group was statistically significantly different from the pelareorep treated group (p=0.005).

