. 2021 Apr 15;21(10):2040–2049. doi: 10.1039/d0lc01289k

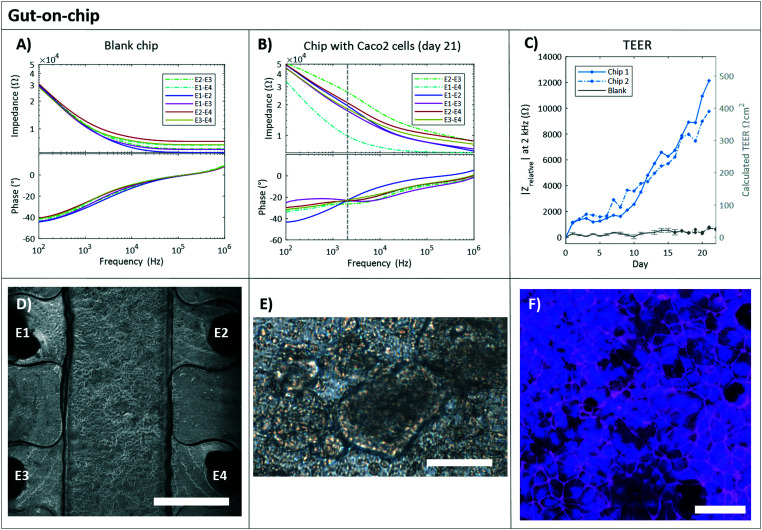
Fig. 3. Gut-on-chip. The typical impedance spectra with magnitude (Ω, top plot) and phase (°, bottom plot) are plotted against the frequency (Hz) for a blank chip containing only DMEM culture medium (A) and a chip with Caco-2 cells cultured for 21 days (B). The continuous lines are the electrode pairs measuring through the PDMS membrane (and cell layer for B), and the dashed lines correspond to the measurements without membrane, between top electrodes (E2–E3) and bottom electrodes (E1–E4). The vertical dashed line indicates the read-out frequency of 2 kHz. C) Relative impedance at 2 kHz of the four electrode pairs measuring through the membrane and cell layer over time in a chip with Caco-2 cells (blue). The day 0 measurement (before cell seeding) was subtracted from all subsequent measurements (n = 2). Also, the relative impedance at 2 kHz of the four electrode pairs measuring through PDMS membrane over time in chips without cells, the blank chips are presented in grey. The day 0 measurement was subtracted from all subsequent measurements. The average of 3 blank chips is shown ± standard deviation (n = 3) up until day 17. At day 17, one chip was excluded from the experiment because after visual inspection leakage at the in- and outlets of the chip was observed. D) Gut-on-chip lined with a monolayer of Caco-2 cells (P30) at day 4 of culture. Phase-contrast image, scale bar represents 750 μm. E) Bright field image of Caco-2 cells on chip at day 21, showing not all cells in focus, indicating the formation of a 3D structure. Scale bar represents 75 μm. F) Immunofluorescence staining indicates the cell nuclei (NucBlue, blue) and tight junction protein ZO-I (magenta) of the Caco-2 cells at day 21. Scale bar represents 50 μm.

Fig. 3