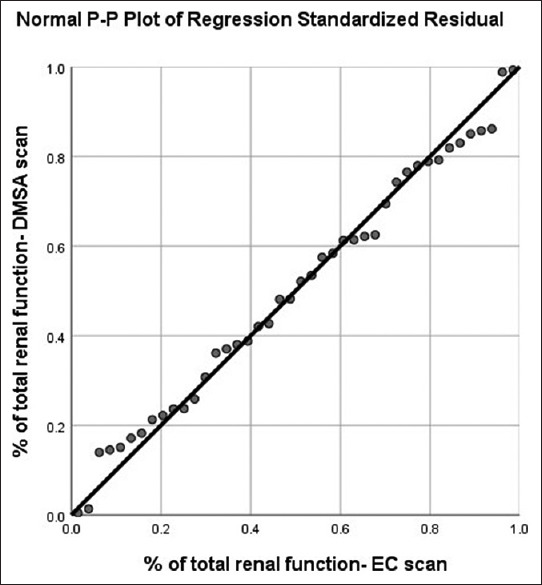
Figure 1.

Plot of measured renal function of the right kidney of each patient with ethylenedicysteine scintigraphy versus dimercaptosuccinic acid scintigraphy in children (n = 42)

Plot of measured renal function of the right kidney of each patient with ethylenedicysteine scintigraphy versus dimercaptosuccinic acid scintigraphy in children (n = 42)