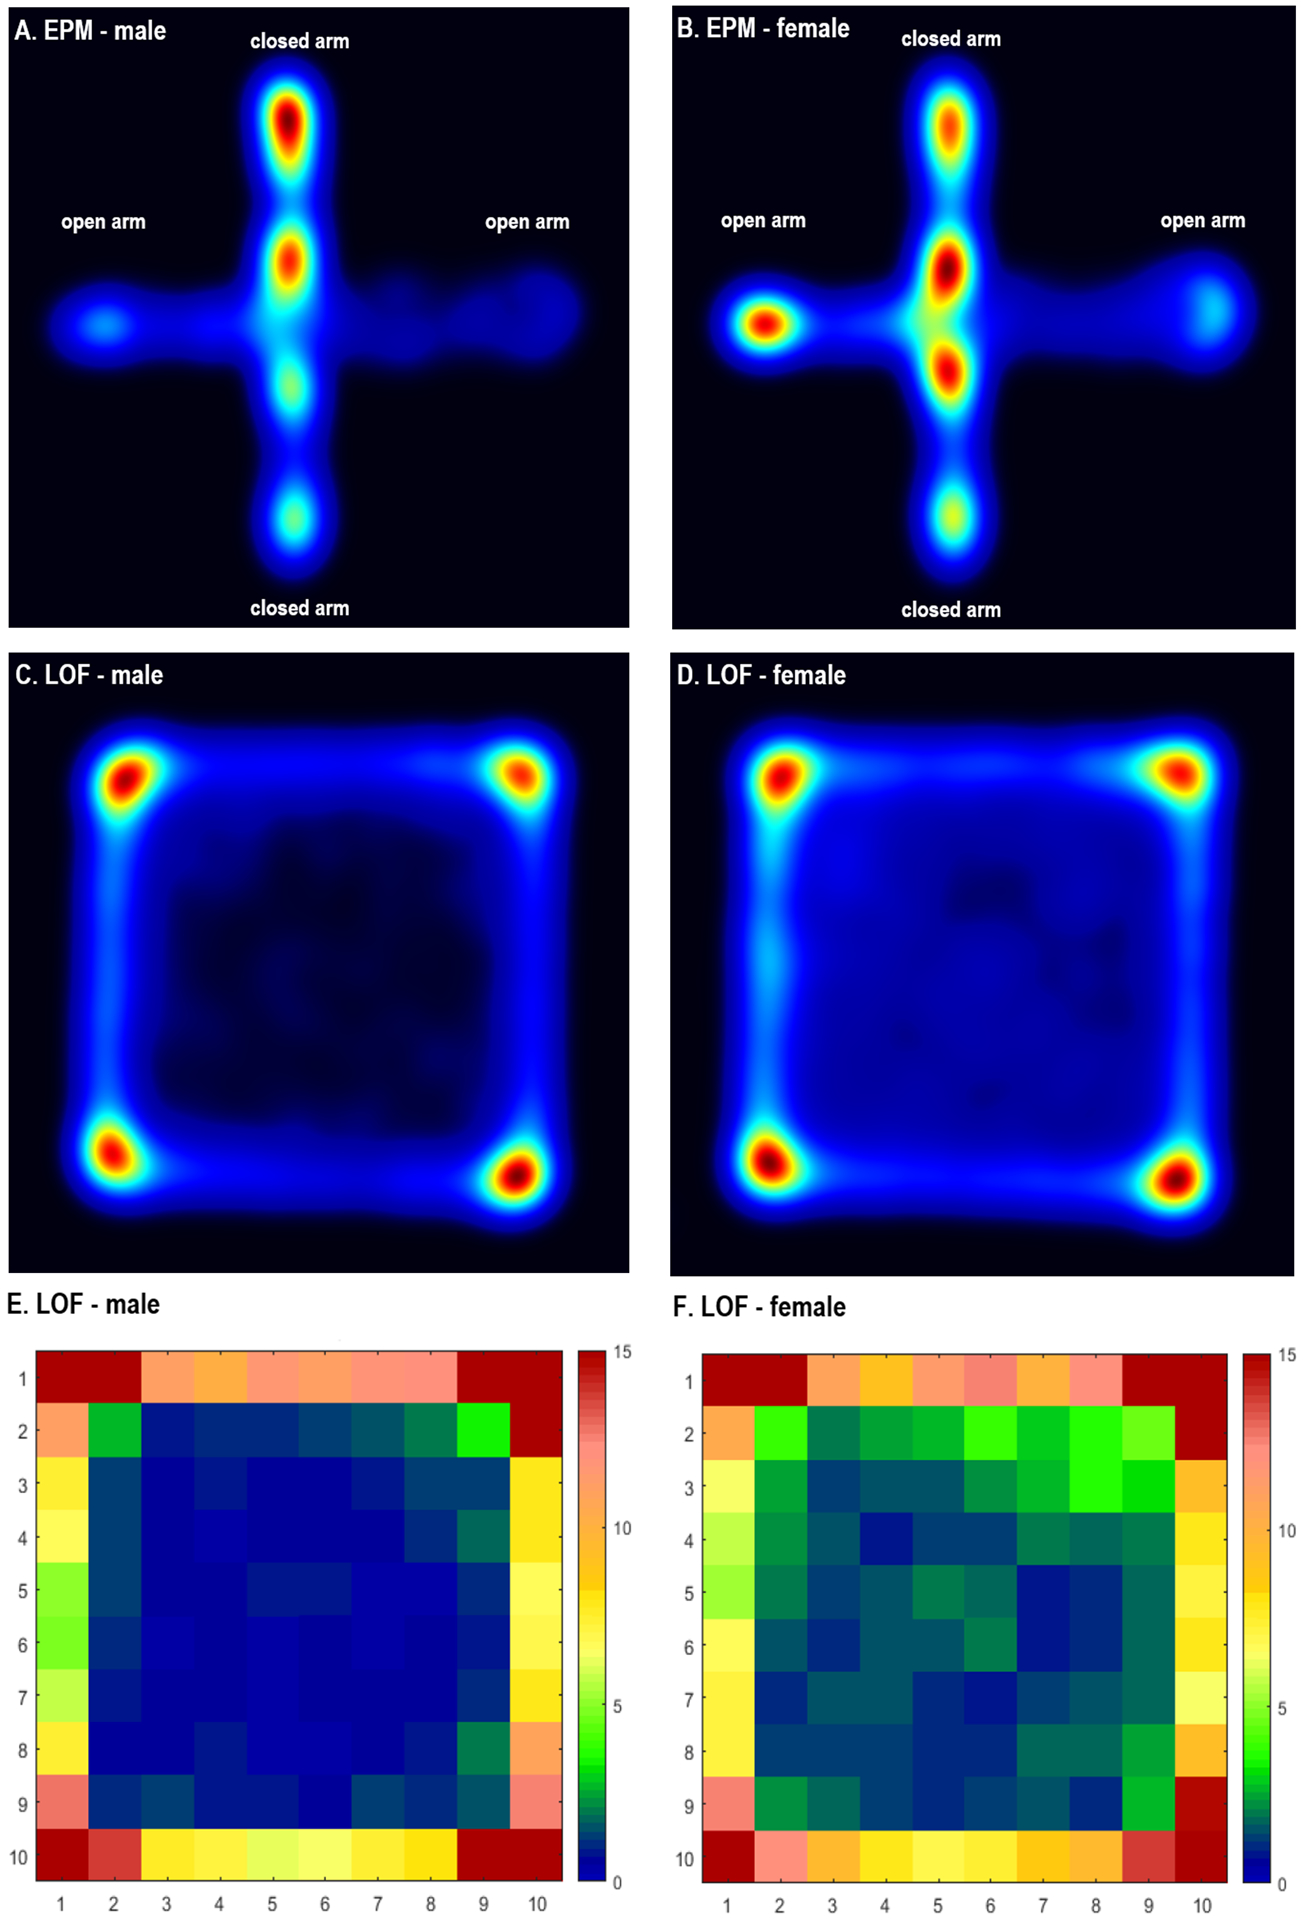
Figure 3. Sex differences in exploratory behavior in the large open field test and the elevated plus-maze test.

The figures show that the males (A) spent less time in the open arms of the EPM and more time in the closed arms of the EPM compared to the females (B). The males (C, E) spent less time in the middle/center zone than the females (D, F) in the LOF. Figs. 3A–D were generated with EthoVision software, and 3E and F were generated with COLORcation software. All track data were obtained with the EthoVision system. Warmer colors indicate more time in spent in a specific area. A and B, N=12/group; C–F, N=47/group.
