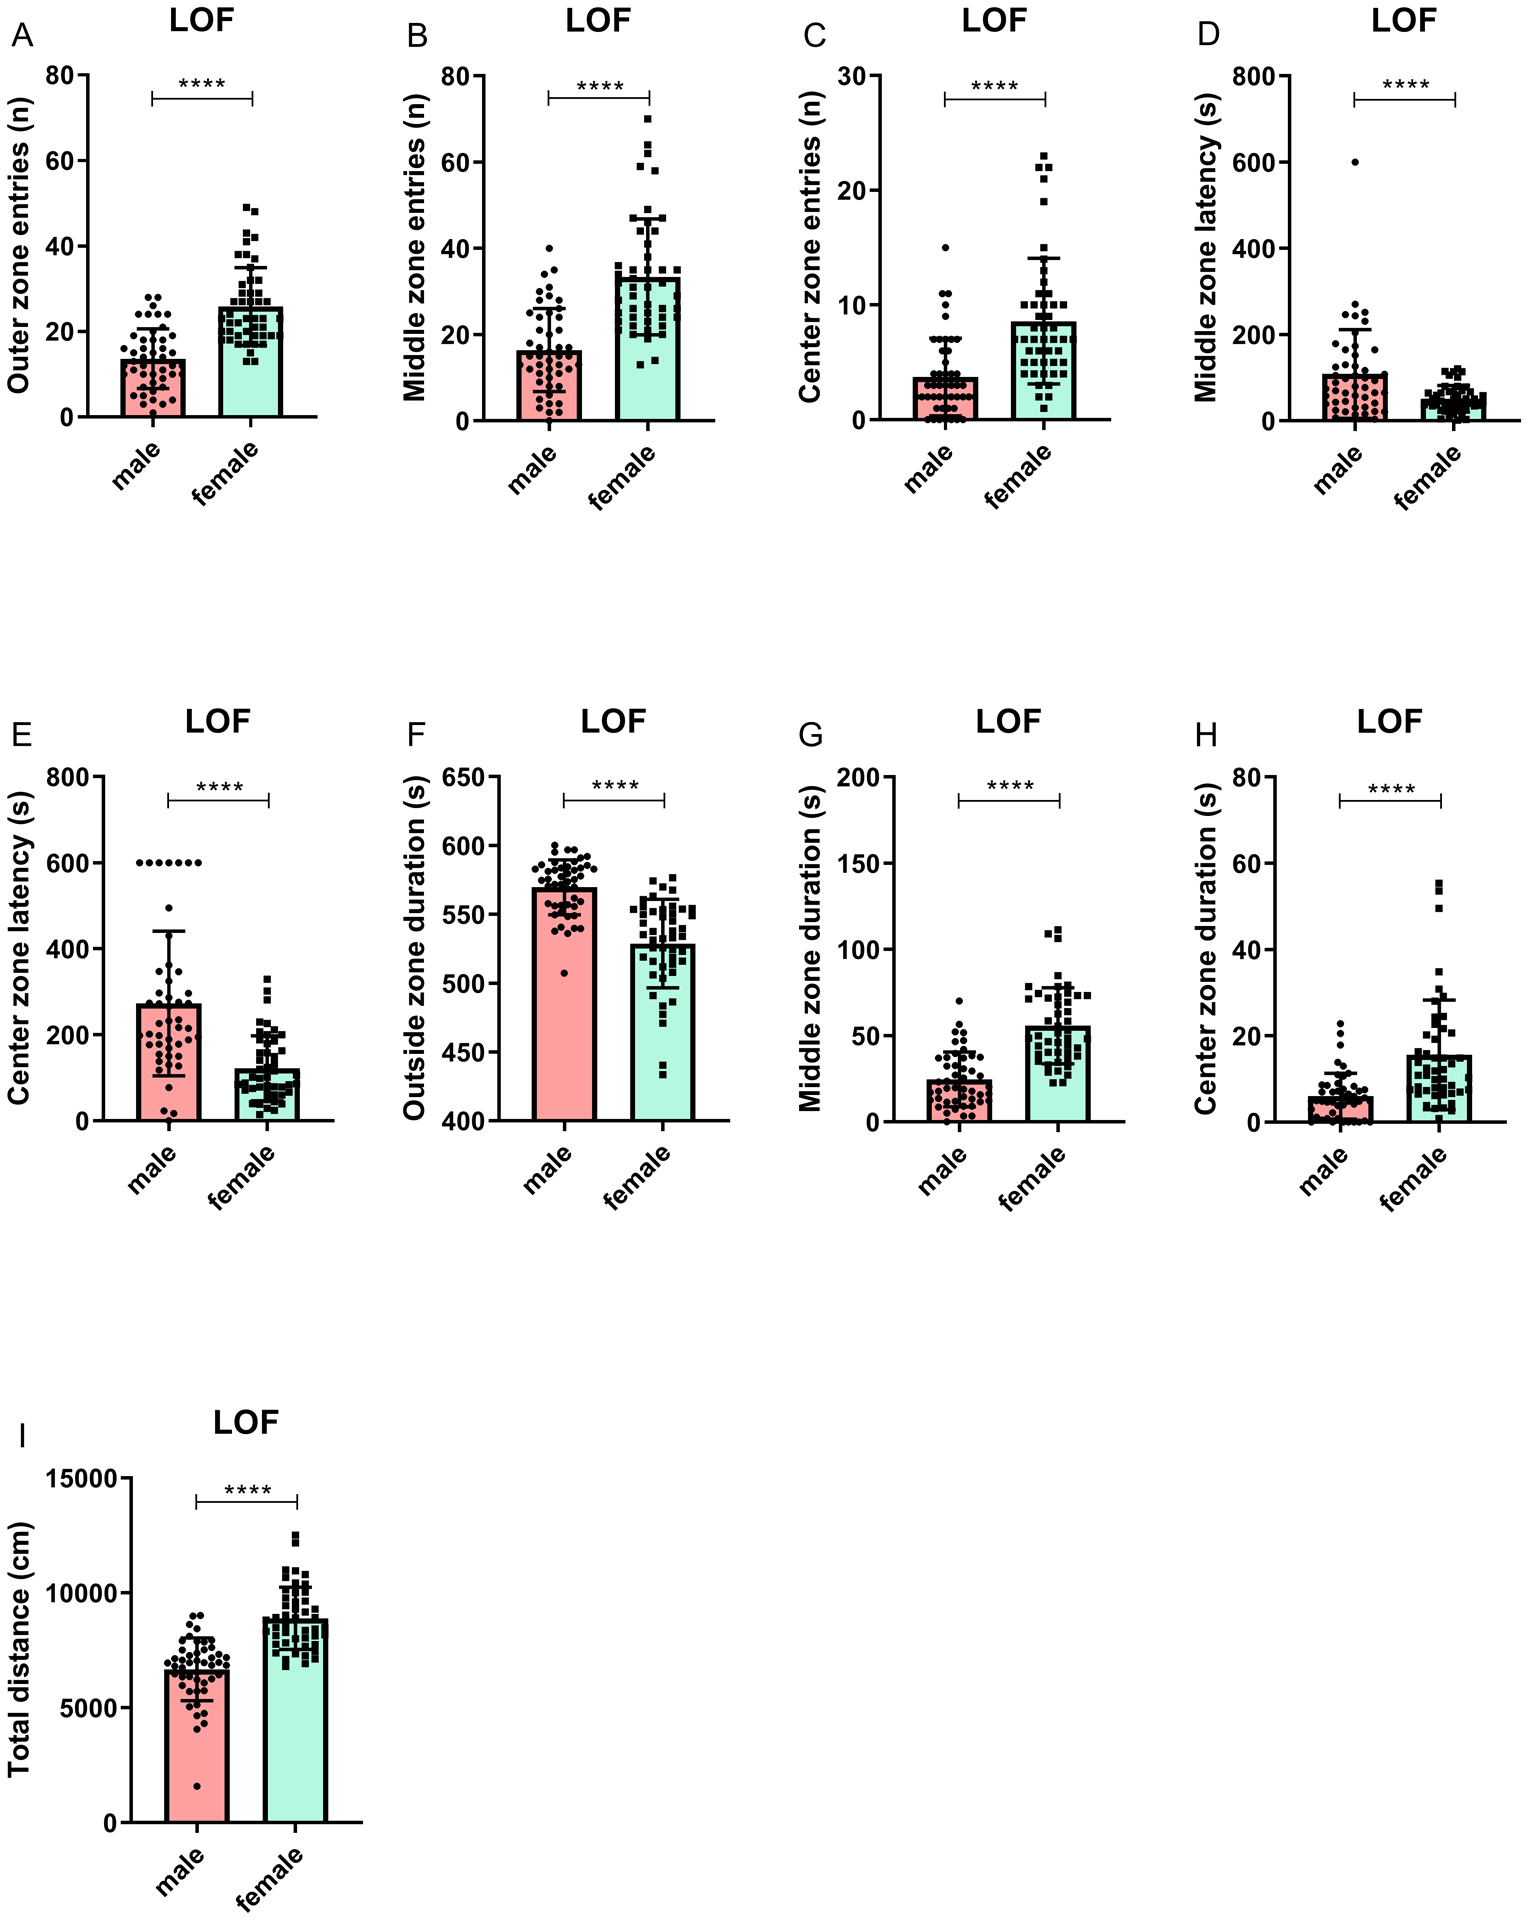
Figure 4. Decreased anxiety-like behavior in female rats compared to male rats in the large open field test.

The figure shows entries into the outer (A), middle (B), and center (C) zone, latency to enter the middle (D) and center zone (E), duration in the outside (F), middle (G), and center zone (H), and total distance traveled. The females were more active and displayed less anxiety-like behavior. N=47/group. **** p<0.0001. Data are expressed as means ± SEM.
