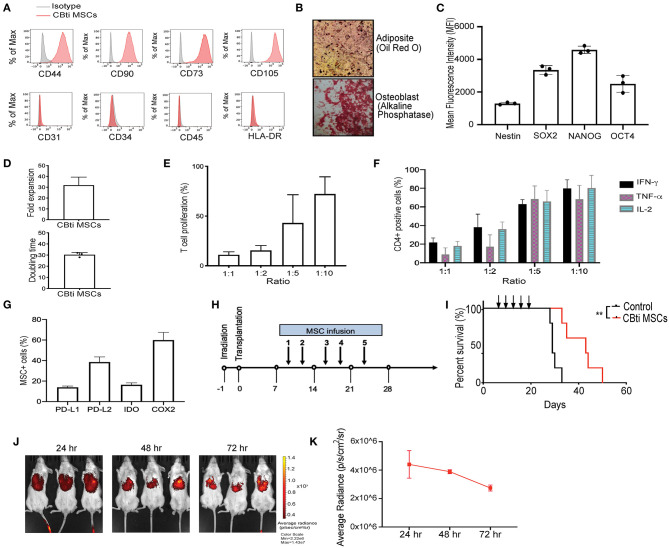
Figure 1.
Characteristics of human cord blood tissue (CBti) derived MSC. (A) Representative histograms showing the expression of typical MSC markers on cord blood tissue derived MSC (28) compared to isotype control (gray) (n = 4). (B) Representative immunostaining slides showing differentiation of cord blood derived MSC into adipocytes shown by Oil Red O stain (upper panel) or osteoblasts shown by alkaline phosphatase staining (lower panel) (n = 2). Magnification ×40. (C) Bar graphs showing the Median Fluorescence Intensity (MFI) of pluripotency markers by CBti derived MSC as assessed by flow cytometry. (D) Bar graphs showing doubling time (upper graph) fold expansion (lower graph) of CBti MSC (28) (n = 4). The bars represent mean values with standard deviation of mean. (E,F) Bar graphs showing the immunomodulatory potential of CBti derived MSC (28) in terms of (E) Percentage of T cell proliferation as compared to positive control after co-culture with MSC at different ratios (n = 3). (F) Bar graph showing the reduction of IFN-y (black bar), TNF-α (purple bar), and IL-2 (green bar) secretion by activated T cells (n = 7). (G) Bar graphs showing the percentage of MSCs cord tissue that express the immunomodulatory factors PD-L1, PD-L2, IDO, and COX-2. (H) Scheme of xenogeneic GVHD mice model. (I) Overall survival of a xenograft GVHD model comparing control mice (injected with PBS, black line), and mice injected with CBti derived MSC (red line) (n = 5 per group). Arrows indicated the days of injection. (J,K) Biodistribution of DiR-labeled CBti MSCs in the same xenograft mouse model of GVHD described in panels G-I over a course of 72 h. (J) Fluorescent images of 3 representative mice per group (K) Plot of average radiance of injected CBti derived MSC showing the standard deviation.

