Figure 2.
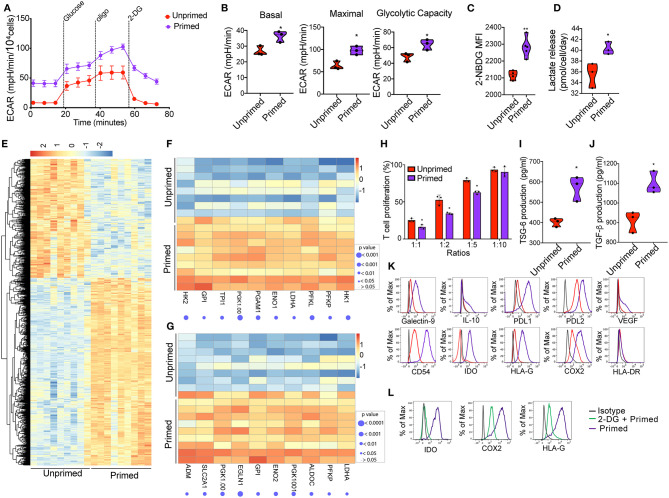
Priming of CBti derived MSC induces metabolic reprogramming associated with an immunosuppressive phenotype. (A) A glycolytic activity as indicated by level of extracellular acidification rate (ECAR) was measured and calculated for primed MSCs (purple line) and control MSC (red lines) treated with 2 g/L D-glucose, 1 μM oligomycin and 100 mM 2-Deoxyglucose (2-DG). A representative graph is shown from three independent experiments. (B) Violin plots summarizing the ECAR data, basal ECAR (left panel), maximal ECAR (central panel) and glycolytic capacity (right panel) of primed MSCs (purple) and unprimed MSCs (28). Statistical significance is indicated as *p ≤ 0.05; bars represent mean values with standard error of mean. (C) Violin plots representing the uptake of glucose shown by 2-NBDG MFI by primed MSCs (purple) or unprimed MSC (red) (28). Statistical significance is indicated as **p ≤ 0.01; bars represent mean values with standard error of mean. (D) Violin plots representing lactate release by primed MSCs (purple) or unprimed MSC (red) (28). Statistical significance is indicated as *p ≤ 0.05; bars represent mean values with standard error of mean. (E) Heatmap showing differential gene expression data of primed MSCs vs. unprimed MSC q < 0.05 and absolute log2 fold change > 2, n = 9. (F) Heatmap showing genes of glycolysis pathway (from GSEA analysis) that are enriched in primed MSCs as compared to unprimed MSC. (G) Heatmap showing genes of hypoxia pathway that are enriched in primed MSCs as compared to unprimed MSC. (H) Bar graphs showing the percentage of T cell proliferation as compared to positive control after co-culture with primed MSCs (purple) vs. unprimed MSC (red) (28) at different ratios for 72 h. n = 3. Statistical significance is indicated as *p ≤ 0.05; bars represent mean values with standard error of mean. Production of (I) TSG-6 and (J) TGF-b by primed MSCs (purple) vs. unprimed MSC (red) as measured by ELISA. n = 3 Statistical significance is indicated as *p ≤ 0.05; bars represent mean values with standard error of mean. (K) Representative histograms showing the expression of related immunosuppressive molecules on unprimed (red) and primed (purple) cord blood tissue derived MSC, compared to isotype control (gray) (n = 4). (L) Representative histograms showing the expression of IDO (left), COX2 (central), and HLA-G (30) on primed cord tissue derived MSCs pretreated with 2-DG (green line) or untreated (purple), compared with the isotype (gray line). (n = 3).

