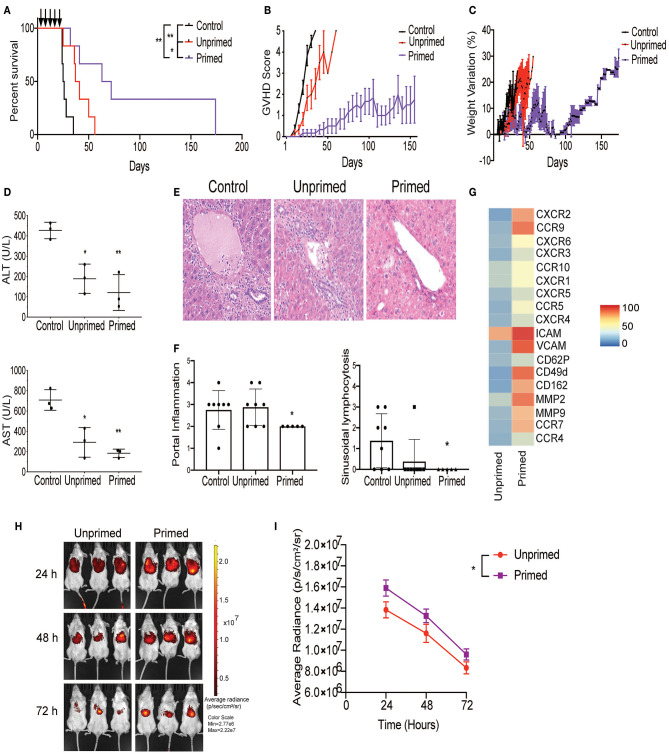
Figure 4.
Primed CBti MSC improve outcome in a xenograft mouse model of GVHD. Impact of CBti MSC therapy in a xenograft mouse model of GVHD comparing survival curve (A), evolution of clinical scores (B), and weight loss (C) over time for each group of recipient mice receiving PBS (control mice, black line), mice injected with unprimed CBti MSCs (red line), or mice injected with primed CBti MSCs (purple line). Statistical significance is indicated as *p ≤ 0.05, **p ≤ 0.01 (n = 6 per group). Arrows indicate the days of injection. (D) Plot of AST and ALT levels determined in the serum of mice at day 29 (n = 3). Statistical significance is indicated as *p ≤ 0.05, **p ≤ 0.01. (E) Representative images of livers for each group. Magnification 20X. (F) Plot of the quantitative analysis of liver histological changes. The grade of inflammation was determined for each animal at the end time point. (G) Heatmap of the surface expression of key chemokine receptors and adhesion molecules involved in the homing of MSC analyzed by flow cytometry. (H) Biodistribution of DiR-labeled unprimed (red) and primed (purple) CBtiMSC over 72 h after intravenously injection in a xenograft GVHD mice model. (I) Plot of cumulative data for radiant efficiencies in the total body. Paired t-test was performed and statistical significance is indicated as *p ≤ 0.05.

