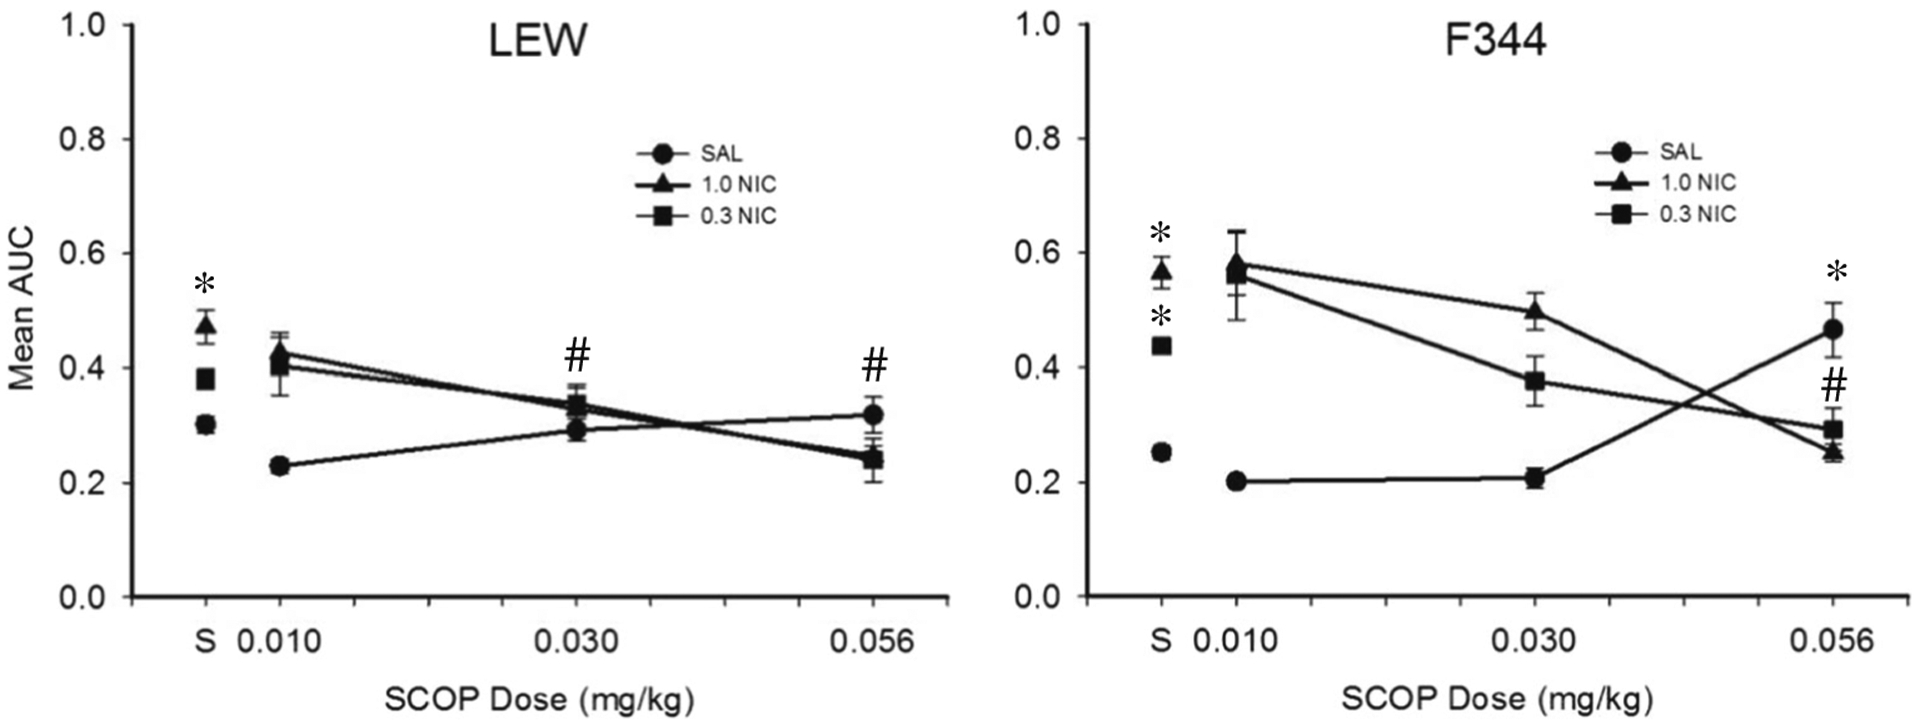
Fig. 6.

Mean AUC for LEW and F344 across all SCOP-NIC drug dose combinations during experiment 2. “S” corresponds to sessions in which SAL-SAL was administered. Note that data for each rat strain are collapsed across delay series. Error bars represent standard error of the mean. Asterisks represent a statistically significant difference from SAL-SAL. Pound symbols represent a statistically significant difference from SAL-NIC (p < 0.05)
