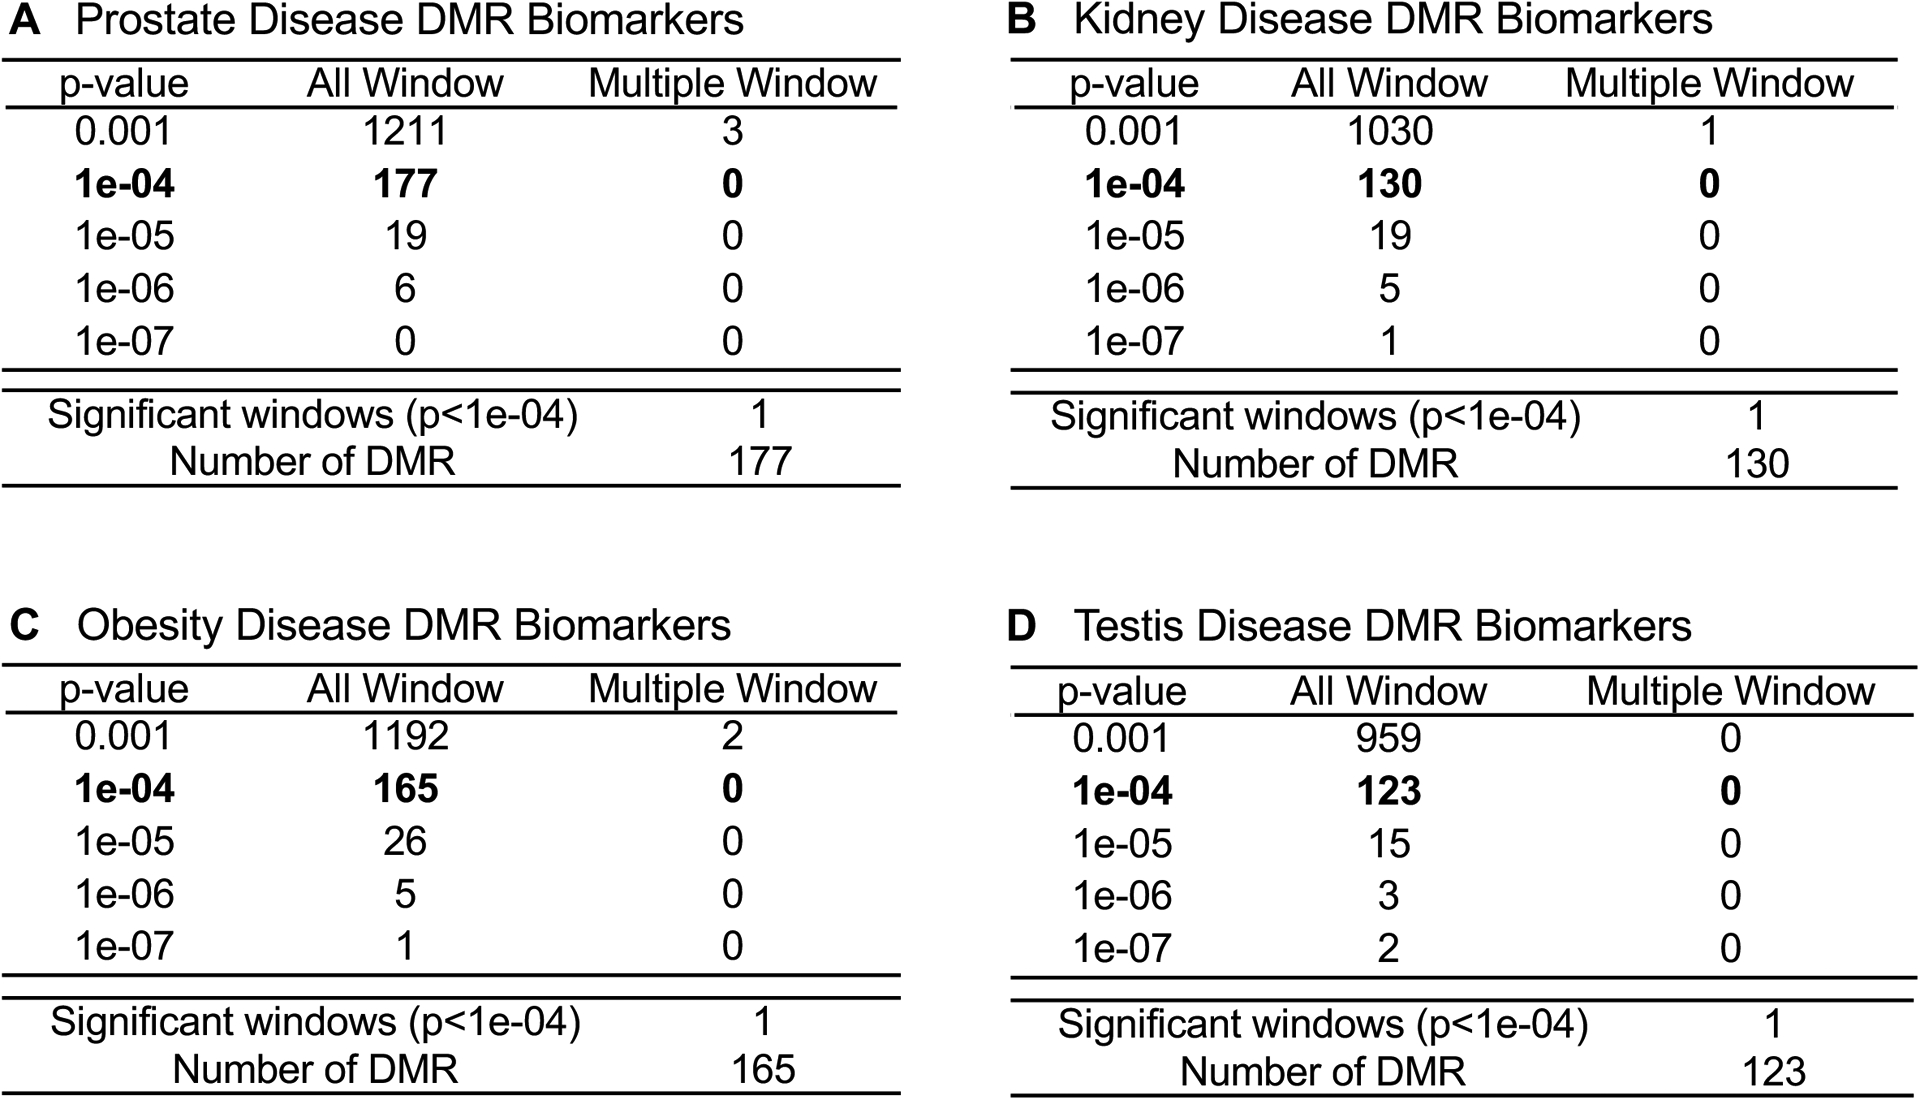
Figure 1.

DMR identification and numbers. The number of DMRs found using different p-value cutoff thresholds. The All Window column shows all DMRs. The Multiple Window column shows the number of DMRs containing at least two significant windows (1 kb each). The number of DMRs with the number of significant windows (1 kb per window) at a p-value threshold p<1e-04 for DMR. (A) Prostate disease DMRs; (B) Kidney disease DMRs; (C) Obesity disease DMRs; and (D) Testis disease DMRs.
