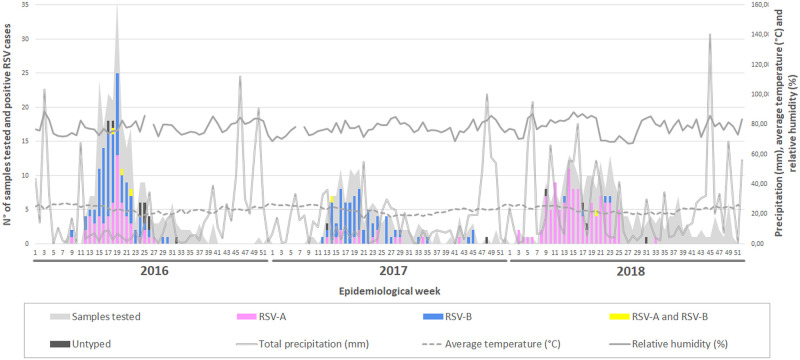
Fig 1. Circulation of RSV-A and RSV-B between 2016 and 2018 in Espirito Santo State.
The X-axis shows the epidemiological weeks (EW) for each year. The primary Y-axis displays the number of positive cases for each of the subtypes and the secondary Y-axis shows the values of the climatic variables. The gray zone indicates the total number of samples tested in each EW.

