Fig 2.
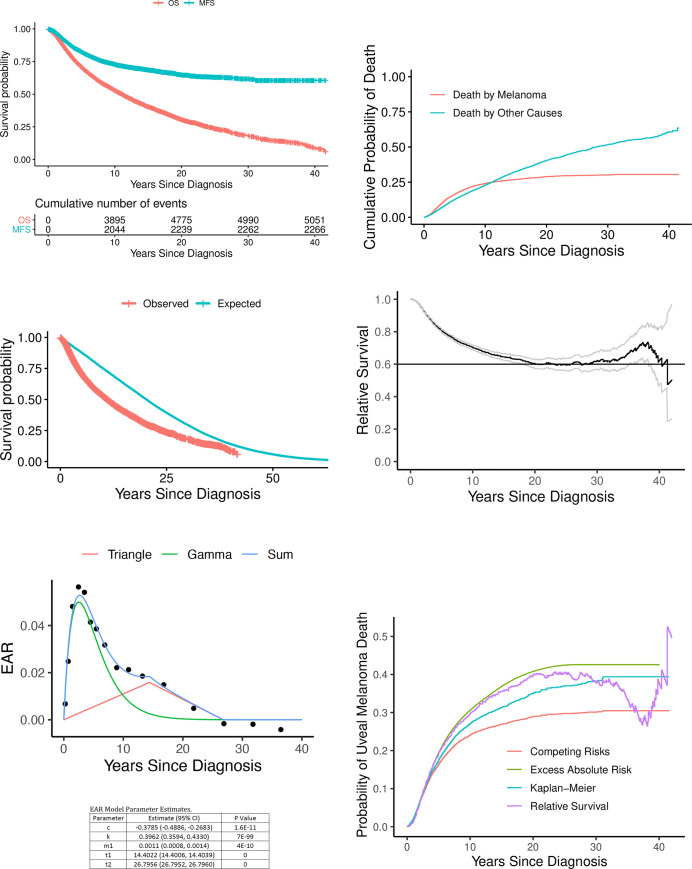
Kaplan-Meier plots (A). OS is difficult to interpret since everyone dies in the long run. MFS counts only deaths due to melanoma. Note that very few patients die due to melanoma 10 years after diagnosis. Cumulative incidence of death (B). These cumulative probabilities of death are integrals of death probability densities that account for competing risks. OS observed vs expected (C). Cumulative incidence of death. OS observed vs expected (C). Relative survival (D) is the ratio of the lower curve divided by the upper curve. The long-term mortality attributable to melanoma is estimated from the stable portion of this curve that lies between 20 and 30 years. (E) Trigam model fit to excess absolute risks of death due to uveal melanoma. Algebraic forms of the triangle wave and gamma function are provided above. Poisson regression was used to fit their sum to EAR “data” generated by the R function msd in SEERaBomb. This excess hazard adds to a subject’s background hazard when diagnosed with uveal melanoma. (F). Comparison of survival methods. The EAR and the RS curves ignore cause of death. The other two curves rely on cause of death information. The KM-based 1-MFS curve is incorrect relative to the cumulative incidence (CI) curve because it does not account for competing risks.

