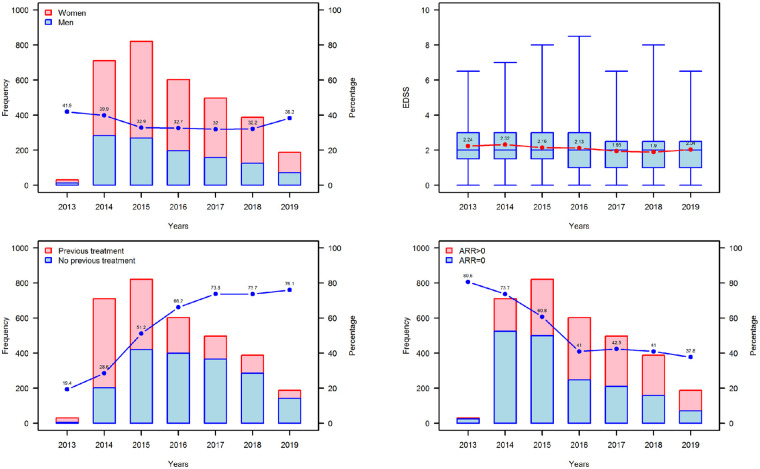
Fig 1. Baseline characteristics of patients starting teriflunomide treatment between 2013–2019 in Denmark.
(A) Frequency and distribution of female (red) and male (blue) patients starting teriflunomide each year. The blue dots denote the percentage of male patients of the total teriflunomide patient starts each year (B) EDSS at teriflunomide start. The red dots show the mean EDSS, whereas the blue boxes show the median (IQR) EDSS per year. (C) Frequency and distribution of treatment-naïve (blue) and previously treated (red) patients starting teriflunomide each year. The blue dots denote the percentage of treatment-naïve patients of the total teriflunomide patient starts each year. (D) Frequency and distribution of patients with an annualized relapse rate (ARR) of 0 (blue) and ARR >0 (red) in the year prior to teriflunomide start. The blue dots denote the percentage of patients with an ARR of 0 out of the total teriflunomide patient starts each year. Note, that teriflunomide received marketing authorization in October 2013 and the cut-off for data collection was September 2019, therefore patient numbers in 2013 and 2019 (dotted boxes) are based on data from approximately 3 and 9 months, respectively.

