Fig. 10.
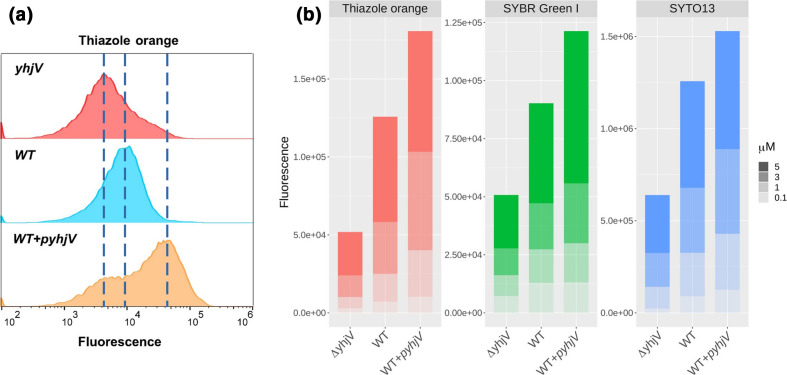
Fluorophores accumulate differentially in E. coli overexpressing the YhjV transporter. (a) Cytograms of the uptake of thiazole orange by E. coli BW25113 with differing expression levels of yhjV. The cell population distribution for the accumulation of thiazole orange (1 µM, 37 °C, 15 min) is presented for the gene knockout of yhjV (∆yhjV) of the Keio collection. The fluorescence signal of reference strain E. coli BW25113 (WT) is approximately 2.5-fold higher than the signal from the gene knockout strain (∆yhjV). The strain of E. coli expressing the yhjV gene from the ASKA collection (WT +pyhjV) shows a further increase in the accumulation of thiazole orange equivalent to approximately 4.5-fold over the signal from the WT (data taken from the assay where the highest differences were observed for 1 µM). (b) E. coli BW25113 overexpressing yhjV displays increased uptake of thiazole orange, SYBR Green I and SYTO13. The fluorescence signals of cells accumulating these fluorophores (37 °C, 15 min) are presented for the gene knockout for yhjV (∆yhjV), the reference strain E. coli BW25113 (WT) and the strain overexpressing the ASKA construct of yhjV (WT +pyhjV). Cells were exposed to four different concentrations of fluorophores up to 5 µM, as indicated. Fluorescence data are the averages of the median values from four biological replicates. The accumulation of these fluorophores in all three strains increased monotonically with ascending dye concentrations. For each fluorophore WT cells gave higher fluorescence signals than strains deleted in yhjV, and likewise cells expressing episomal yhjV (WT +pyhjV) over the reference strain (WT). The latter relation for thiazole orange at 1 µM is somewhat smaller (approximately 2.62-fold) than that shown in (a) (4.5-fold), since here we have the average of four experimental replicates.

