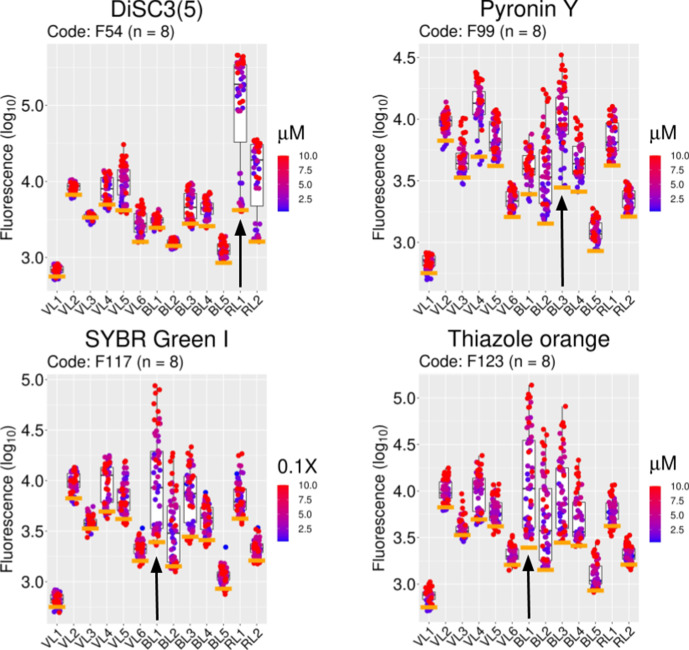
Fig. 4.
Examples of specific fluorophore uptake in E. coli BW25113. Fluorescence signals from 4 fluorophores selected from the set of 47 molecules (Table 1) with values twofold or higher above autofluorescence. The signals for all fluorophores (log10 values, ordinate) are compiled against autofluorescence (orange bars) for every channel (abscissa). The light signal range for each channel is given in the Methods section. Colour-coded distributions of data by concentration of fluorophore (micromolar) are shown. The median values (log10) in channel RL1 for DiSC3 and BL3 for pyronin Y are 50-fold (at 1.3 µM) and 4-fold (at 1.3 µM) above autofluorescence, respectively. In channel BL1 SYBR Green I (stock diluted 10000×) and thiazole orange (10 µM) showed log10 values above autofluorescence equivalent to 3.2-fold and 4-fold, respectively. The chosen channel for each fluorophore is mapped with a black vertical arrow. Each concentration is represented by eight biological replicates taken over a period of 5 months.

