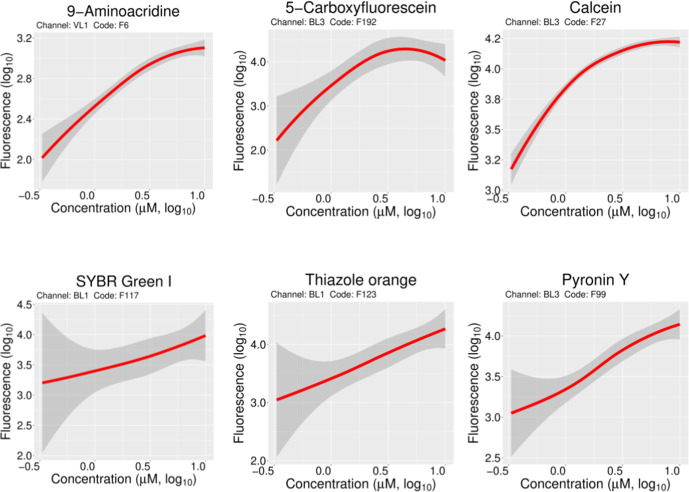
Fig. 5.
Effect of concentration on fluorophore uptake. Locally weighted scatterplot smoothing was applied to the fluorescence signal versus fluorophore concentration (1, 2.5, 3, 5, 7.5 and 10 µM). These data were from 6 of the 47 initially chosen fluorophores (see also Fig. S2). Three fluorophores detected in channels VL1 (9-aminoacridine) and BL3 (5-carboxyfluorescein and calcein) only showed linearity up to 1 µM. The dose–response trend was essentially linear for SYBR Green I (channel BL1), thiazole orange (channel BL1) and pyronin Y (channel BL3) up to 10 µM.

