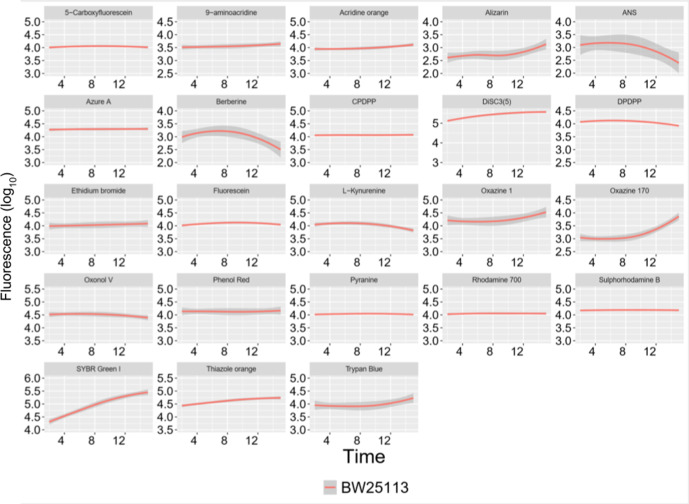
Fig. 6.
Representative time courses for fluorophore uptake. Locally weighted scatterplot fitting was applied to the fluorescence signal versus time data to follow the levels of fluorophore uptake in the time frame relevant to the experimental settings. x-axis: time in minutes (up to 15). y-axis: the log10 of fluorescence signals. For the fluorescence uptake experiments with different incubation times. The subset shown consisted of 23 dyes out of the 39 dyes used earlier.

