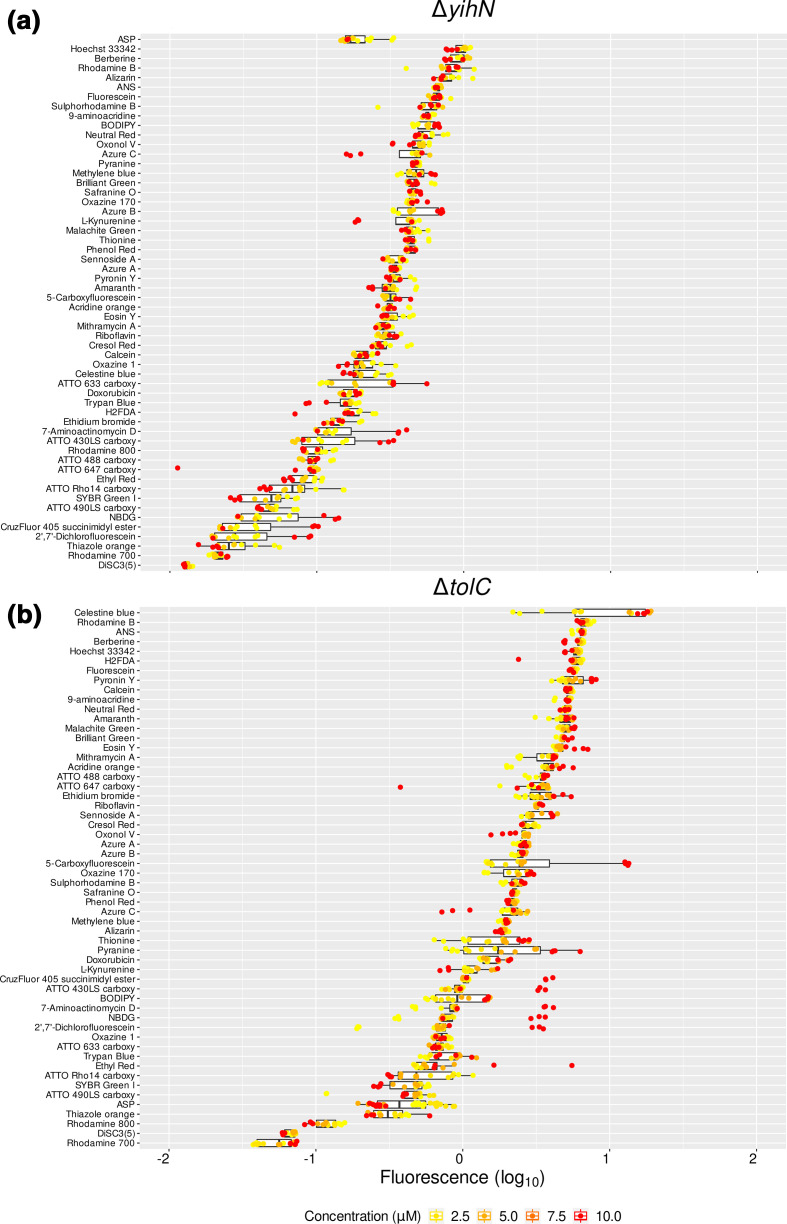
Fig. 9.
E. coli membrane influxers and effluxers have discriminatory fluorophore accumulation profiles. (a) Fluorophore uptake in the E. coli gene knockout strain yihN. Fluorescence signals are presented as the log10 of ratios of the fluorescence from the yihN knockout cells (∆yihN) over the fluorescence signals from the reference cells (BW25113). x-axis: log10 of the ratios (log10=0). No difference against the reference strain would have had a ratio of 1 (log10=0). (b) Fluorophore uptake in the E. coli gene knockout strain tolC. Fluorescence signals are presented as the log10 of ratios of the fluorescence from the tolC knockout cells (∆tolC) over the fluorescence signals from the reference cells (BW25113). x-axis: log10 of the ratios (log10=0). No difference against the reference strain would have had a ratio of 1 (log10=0). Boxplots are ordered by median (highest on top of the plot). The legend lists the concentrations used for each fluorophore.

