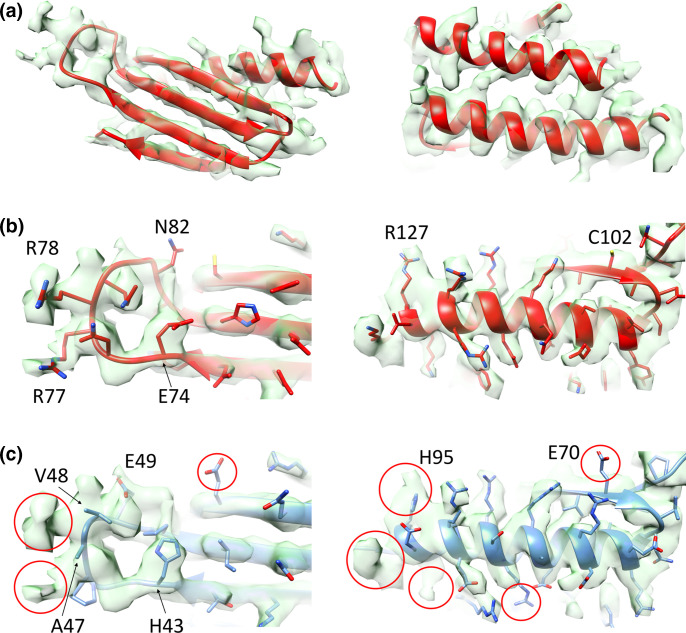
Fig. 3.
Comparison of the density corresponding to Mpy within the 3.11 Å resolution cryo-EM map of the 70S-Mpy complex (EMD-23076) with atomic models of Mpy and MSMEG_3935. (a) Overall fitting of the atomic model (red) of the N-terminal domain of Mpy into the corresponding cryo-EM density (semitransparent green) shown from two opposite sides of the molecule. (b) Magnified views of some of the modelled segments of Mpy (red) (E74 – N82 and C102 - R127) based on the secondary structural elements and side-chain information inferred from the cryo-EM map (EMD-23076). (c) Magnified views of the analogous segments from the MSMEG_3935 model (blue) docked into the same cryo-EM map (semitransparent green). Red circles highlight the regions of incompatibility between the atomic model of MSMEG_3935 and the cryo-EM density corresponding to Mpy in our 70S-Mpy complex.

