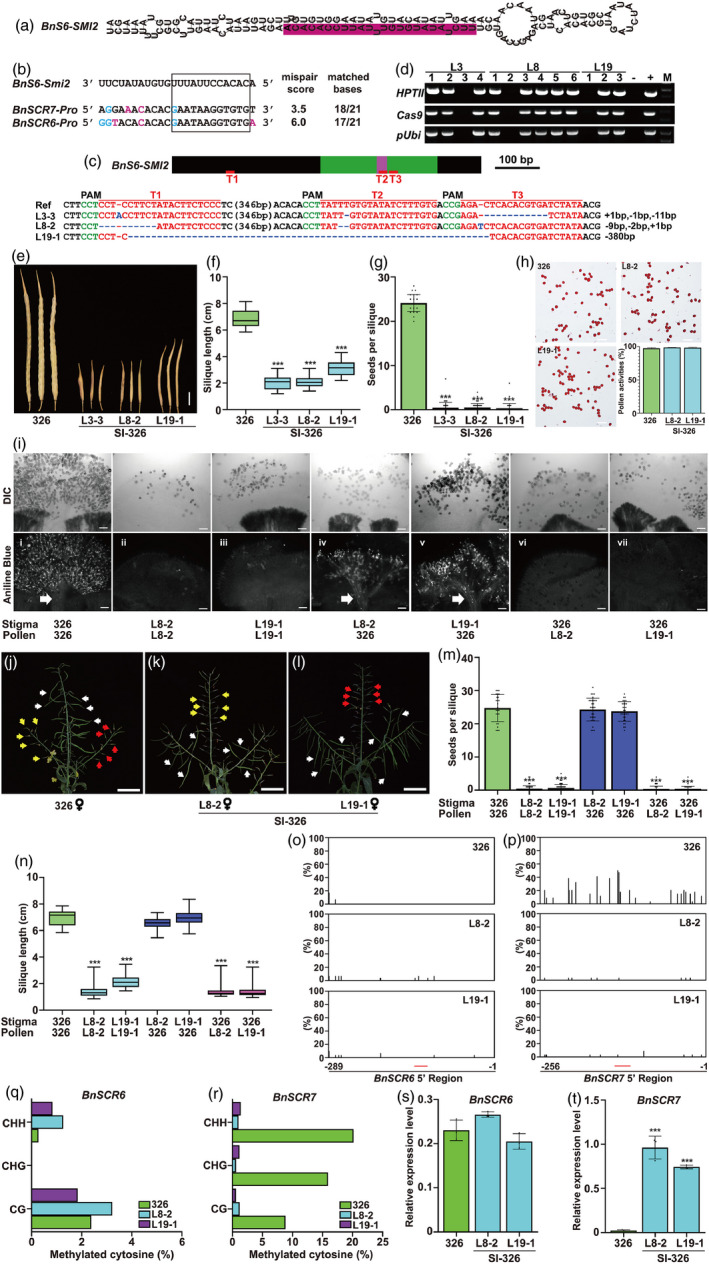
Figure 1.

Generation of self‐incompatible B. napus by knocking out BnS6‐Smi2 via CRISPR/Cas9. (a) Stem‐loop structure of BnS6‐Smi2 precursor. The mature BnS6‐Smi2 is shown in prune. (b) Alignment of BnSCR6 and BnSCR7 promoter regions and seed sequence of BnS6‐Smi2. Mismatched bases and G/U pairs are shown in magenta and blue, respectively. (c) BnS6‐Smi2, including the sequences outside the siRNA precursor (black boxes), precursor region (green boxes) and mature siRNA (pink box). The red lines under the gene model indicate the sgRNA target sites. The protospacer adjacent motif (PAM) is shown in green. The sgRNA is shown in red. The mutation sites are indicated in blue. (d) Images showing PCR products of Cas9, HPTII and pUbi in SI‐326 lines in the T1 generation. +: pRGEB32 is used as the positive control. ‐: gDNA of 326 is used as the negative control. (e) The silique phenotypes of 326 and SI‐326 at 8 weeks after self‐pollination. Scale bars = 1 cm. (f) Quantification of silique length of 326 and SI‐326 after self‐pollination. (g) Seeds per silique of 326 and SI‐326 after self‐pollination. (h) Images showing the pollen viability of 326 and SI‐326. Quantification of pollen viability of 326 and SI‐326 is also shown. Scale bars = 100 µm. (i) Typical DIC (upper panel) and aniline blue staining (lower panel) of 326 and SI‐326 pistils after self‐ or cross‐pollination. A bundle of PTs indicates compatible pollination (white arrow). Scale bars = 100 µm. (j)–(l) Images showing the 326 and SI‐326 siliques pollinated by 326 and SI‐326 pollen. Pollens from 326, L8‐2 and L19‐1 are indicated by white, yellow and red arrows, respectively. Scale bars = 5 cm. (m) Seeds per silique of 326 and SI‐326 after self‐ or cross‐pollination. (n) Quantification of silique length of 326 and SI‐326 after self‐ or cross‐pollination. (o) ‐ (p) Percentage of methylation at all cytosine residues in 326 and SI‐326 in the promoter regions of BnSCR6 (nucleotides—289 to −1) (o) and BnSCR7 (nucleotides −256 to −1) (p). The red line indicates the region homologous to BnS6‐Smi2. (q)–(r) Percentage of cytosine methylation of CpG, CpNpG and CpNpN in 326 and SI‐326 in the promoter regions of BnSCR6 (nucleotides—289 to −1) (q) and BnSCR7 (nucleotides—256 to −1) (r). (s)–(t) Expression levels of BnSCR6 (s) and BnSCR7 (t) in 326 and SI‐326. Data are means ± SD (n = 3) obtained from three biological replicates. BnActin is used as the internal control. In (f), (g), (m) and (n), at least three plants per line were sampled for each measurement. Error bars are means ± SD (n ≥ 25), *** indicate significant differences at P < 0.001, based on ANOVA.
