(
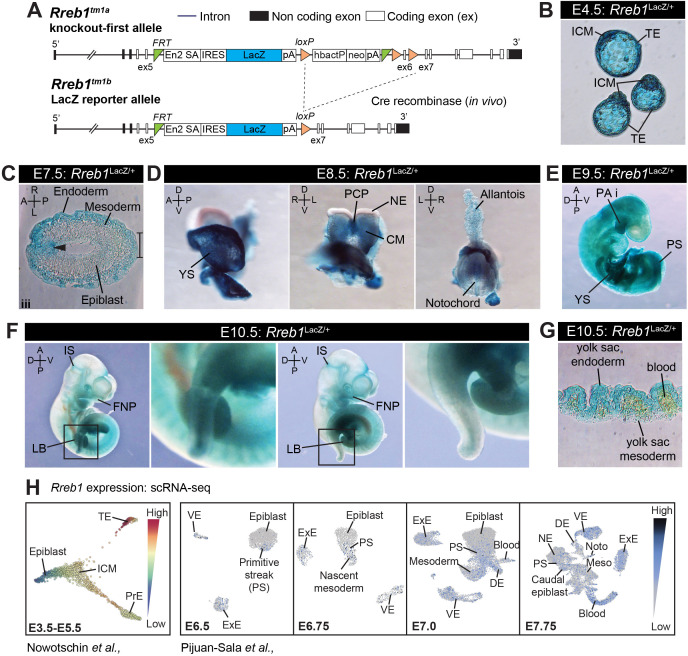
A) Schematic diagram showing the EUCOMM knockout-first (Tm1a) allele (upper panel) and the
Rreb1 null LacZ reporter (Tm1b) allele generated by Cre-mediated recombination of Tm1a (lower panel).
Engrailed two splice acceptor (En2 SA), internal ribosome entry side (IRES), human beta actin promoter (hbactP), Neomycin cassette (neo), single polyadenylation sequences (pA),
FRT sites (green triangles),
loxP sites (orange triangles). (
B) Wholemount images of E4.5
Rreb1LacZ/+ blastocysts. (
C) Transverse cryosection through a distal region of an E7.5
Rreb1LacZ/+ embryos from
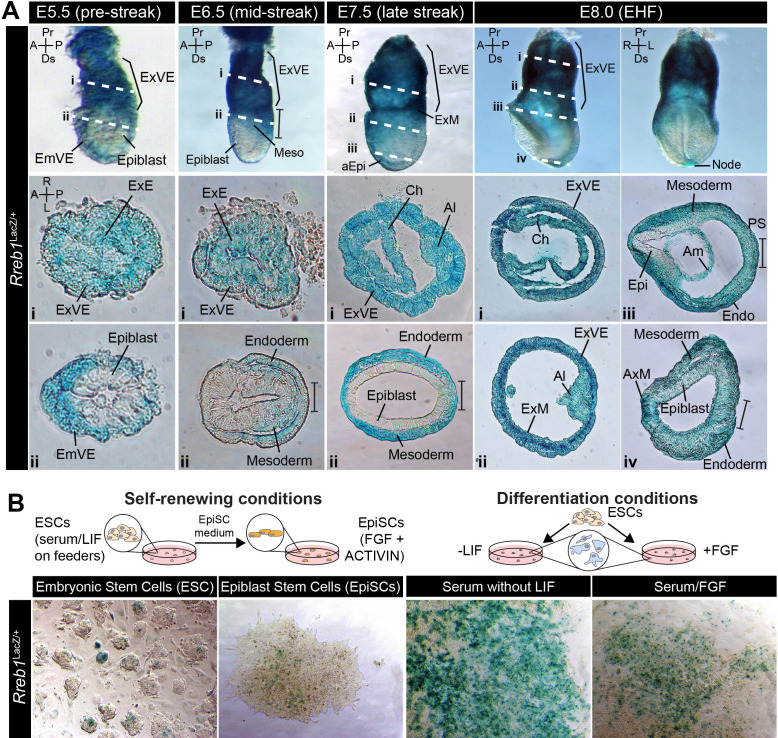
Figure 1A. Arrowhead indicates expression within the distal anterior epiblast. Bracket marks the primitive streak/tailbud. (
D–F) Wholemount images of
Rreb1LacZ/+ embryos. (
G) Transverse cryosection of the yolk sac of an E10.5
Rreb1LacZ/+ embryo. (
H)
Rreb1 expression in different cell types of the early mouse embryo, from published single-cell RNA-sequencing datasets. Left panel: Force-directed layout plot showing relative
Rreb1 expression in cells of E3.5–4.5 pre-implantation and E5.5 early post-implantation embryos from single-cell RNA sequencing (scRNA seq.) data. Plot was generated using data from
Nowotschin et al., 2019 (
https://endoderm-explorer.com/). Right panel: Uniform manifold approximation and projection (UMAP) plot, generated using single-cell sequencing data from
Pijuan-Sala et al., 2019 (
https://marionilab.cruk.cam.ac.uk/MouseGastrulation2018/), showing
Rreb1 expression levels in all the cells at E6.5, 6.75, 7.0, and 7.75. TE, trophectoderm; ICM, inner cell mass; PrE, primitive endoderm; VE, visceral endoderm; ExE, extraembryonic ectoderm; PS, primitive streak; DE, definitive endoderm; Epi, epiblast; Noto, notochord; Meso, mesoderm; NE, neurectoderm; PCP, prechordal plate; Pr, proximal; Ds, distal; A, anterior; P, posterior; L, left; R, right; YS, yolk sac; PA i, pharyngeal arch 1; FNP, frontonasal process; LB, limb bud; IS, isthmus; CM, cephalic mesenchyme.


